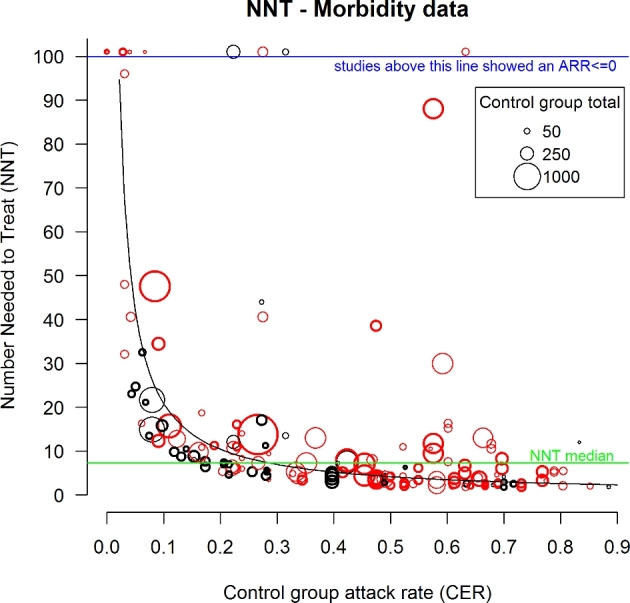
Figure 4.

NNT plot of all morbidity data from RCTs involving either antimicrobial prophylaxis (red circles) or metaphylaxis (black circles). Size of the circles reflects the sample size of the RCT (see the legend). Bolded circles are blinded RCTs. Green line represents the overall NNT median value = 7.27. The curve represents the expected NNT as a function of CER assuming a uniform RR (=0.52) across all values of CER. NNT, number needed to treat; ARR, absolute risk reduction; RCT, randomised clinical trial.
