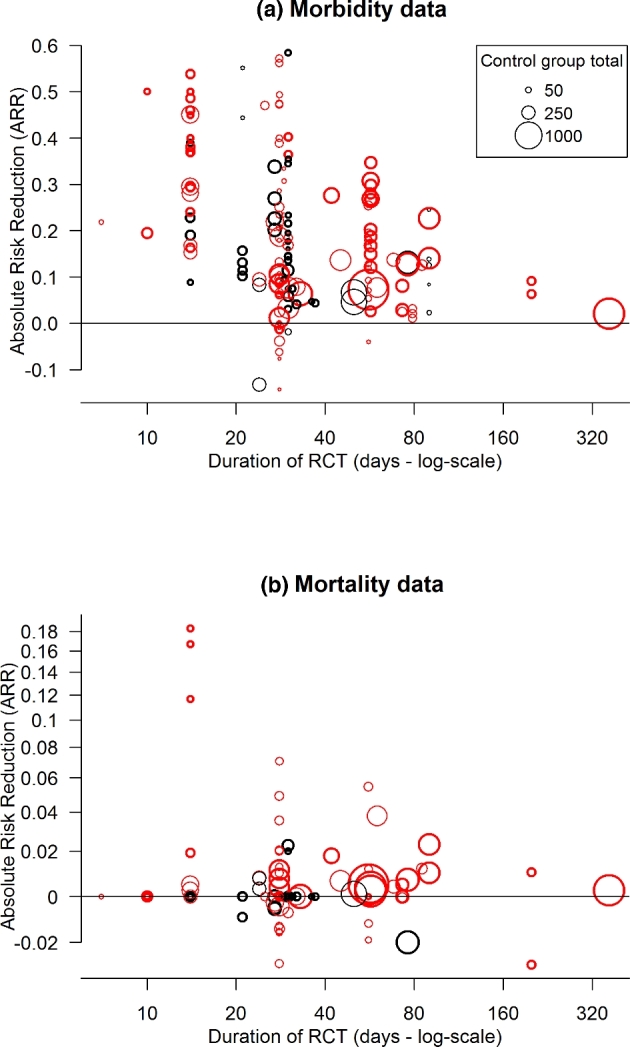
Figure 5.

Plot of absolute risk reductions in (a) morbidity or (b) mortality for each RCT versus the duration of the RCT. For publications stating a range of duration days for RCTs, then the average value was calculated. RCTs involving either antimicrobial prophylaxis (red circles) or metaphylaxis (black circles). Size of the circles reflects the sample size of the RCT (see the legend). Bolded circles are blinded RCTs. For the purpose of visualisation of the wide range of ARR values for the mortality data, the y-values in (b) are shown on a modified log-scale (sign(y)*log10(10*y+ 1)). Labels at the tick marks are the original ARR values.
