
Fig. 4.
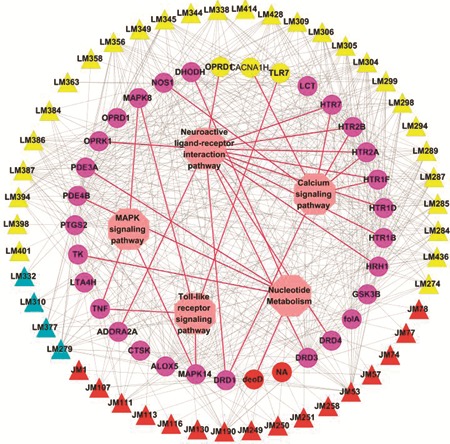
C–T–P network. The information about the pathways as defined by the KEGG was collected and then the T–P network was built by connecting the targets and their related signaling pathways. The C–T–P network was constructed by overlaying the C–T network onto T–P network. The colors of compound and target nodes are the same as Fig. 2, and the pathway node is represented as pink hexagon.