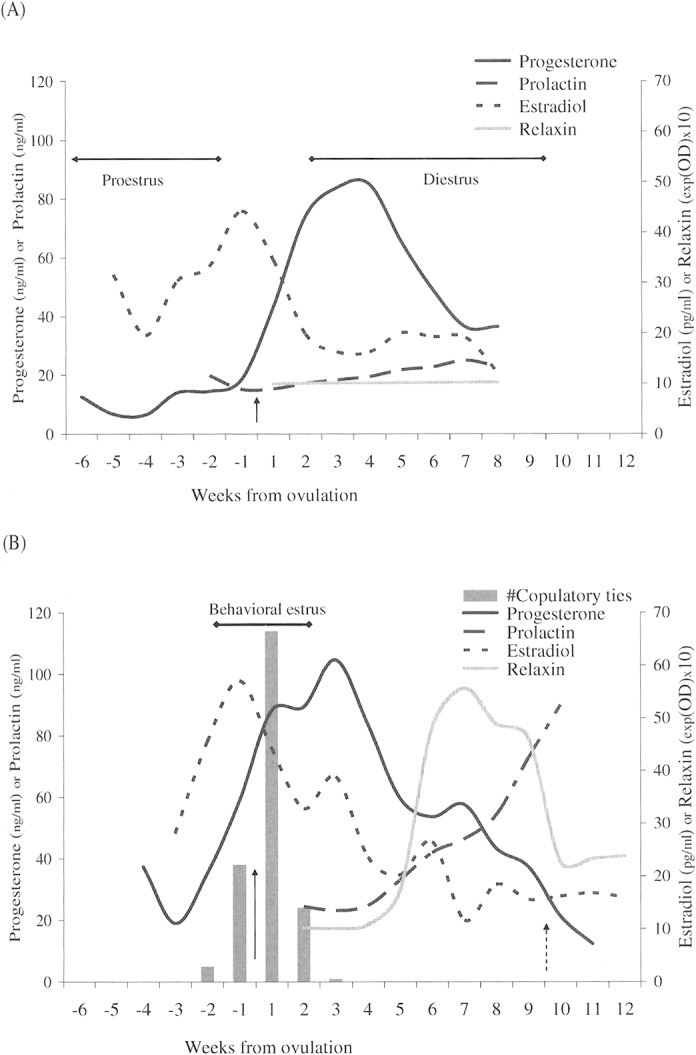
Fig. 2.

Temporal relationship of weekly mean blood levels of estradiol (pg/ml), progesterone (ng/ml), prolactin (ng/ml), and relaxin (exp(optical density) × 10; for graphical representation only), aligned to the estimated day of ovulation (day 0). A) Pseudopregnant females; B) pregnant coyotes. Solid arrow indicates ovulation. Columns indicate weekly number of copulatory ties observed during the breeding seasons in 2000–2003; dashed arrow indicates day of parturition (day 64 postovulation). Solid bars indicate phases of ovarian cycle studied.
