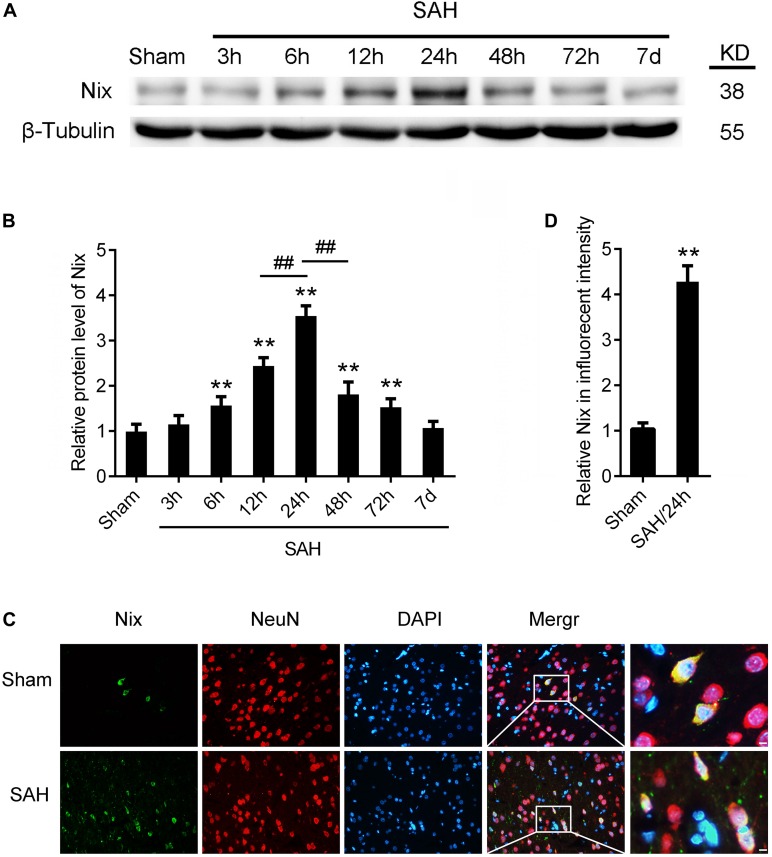
FIGURE 3.
The expression of Nix in brain tissue after SAH. (A,B) Western blot showed that the protein level of Nix at 3, 6, 12, 24, 48, and 72 h, as well as 7 days, after SAH in brain tissues. Data represent the mean ± SD; **p < 0.01 vs. Sham group; ##p < 0.01 vs. SAH 12 h group, ##p < 0.01 vs. SAH 48 h group; n = 6. (C,D) Double immunofluorescence for Nix (green) and NeuN (red) counterstained with DAPI (blue) was performed. Representative images of the Sham group and SAH (24 h) group were shown. Data represent the mean ± SD. (Scale bar = 20 μm; **p < 0.01 vs. Sham group, n = 6).

