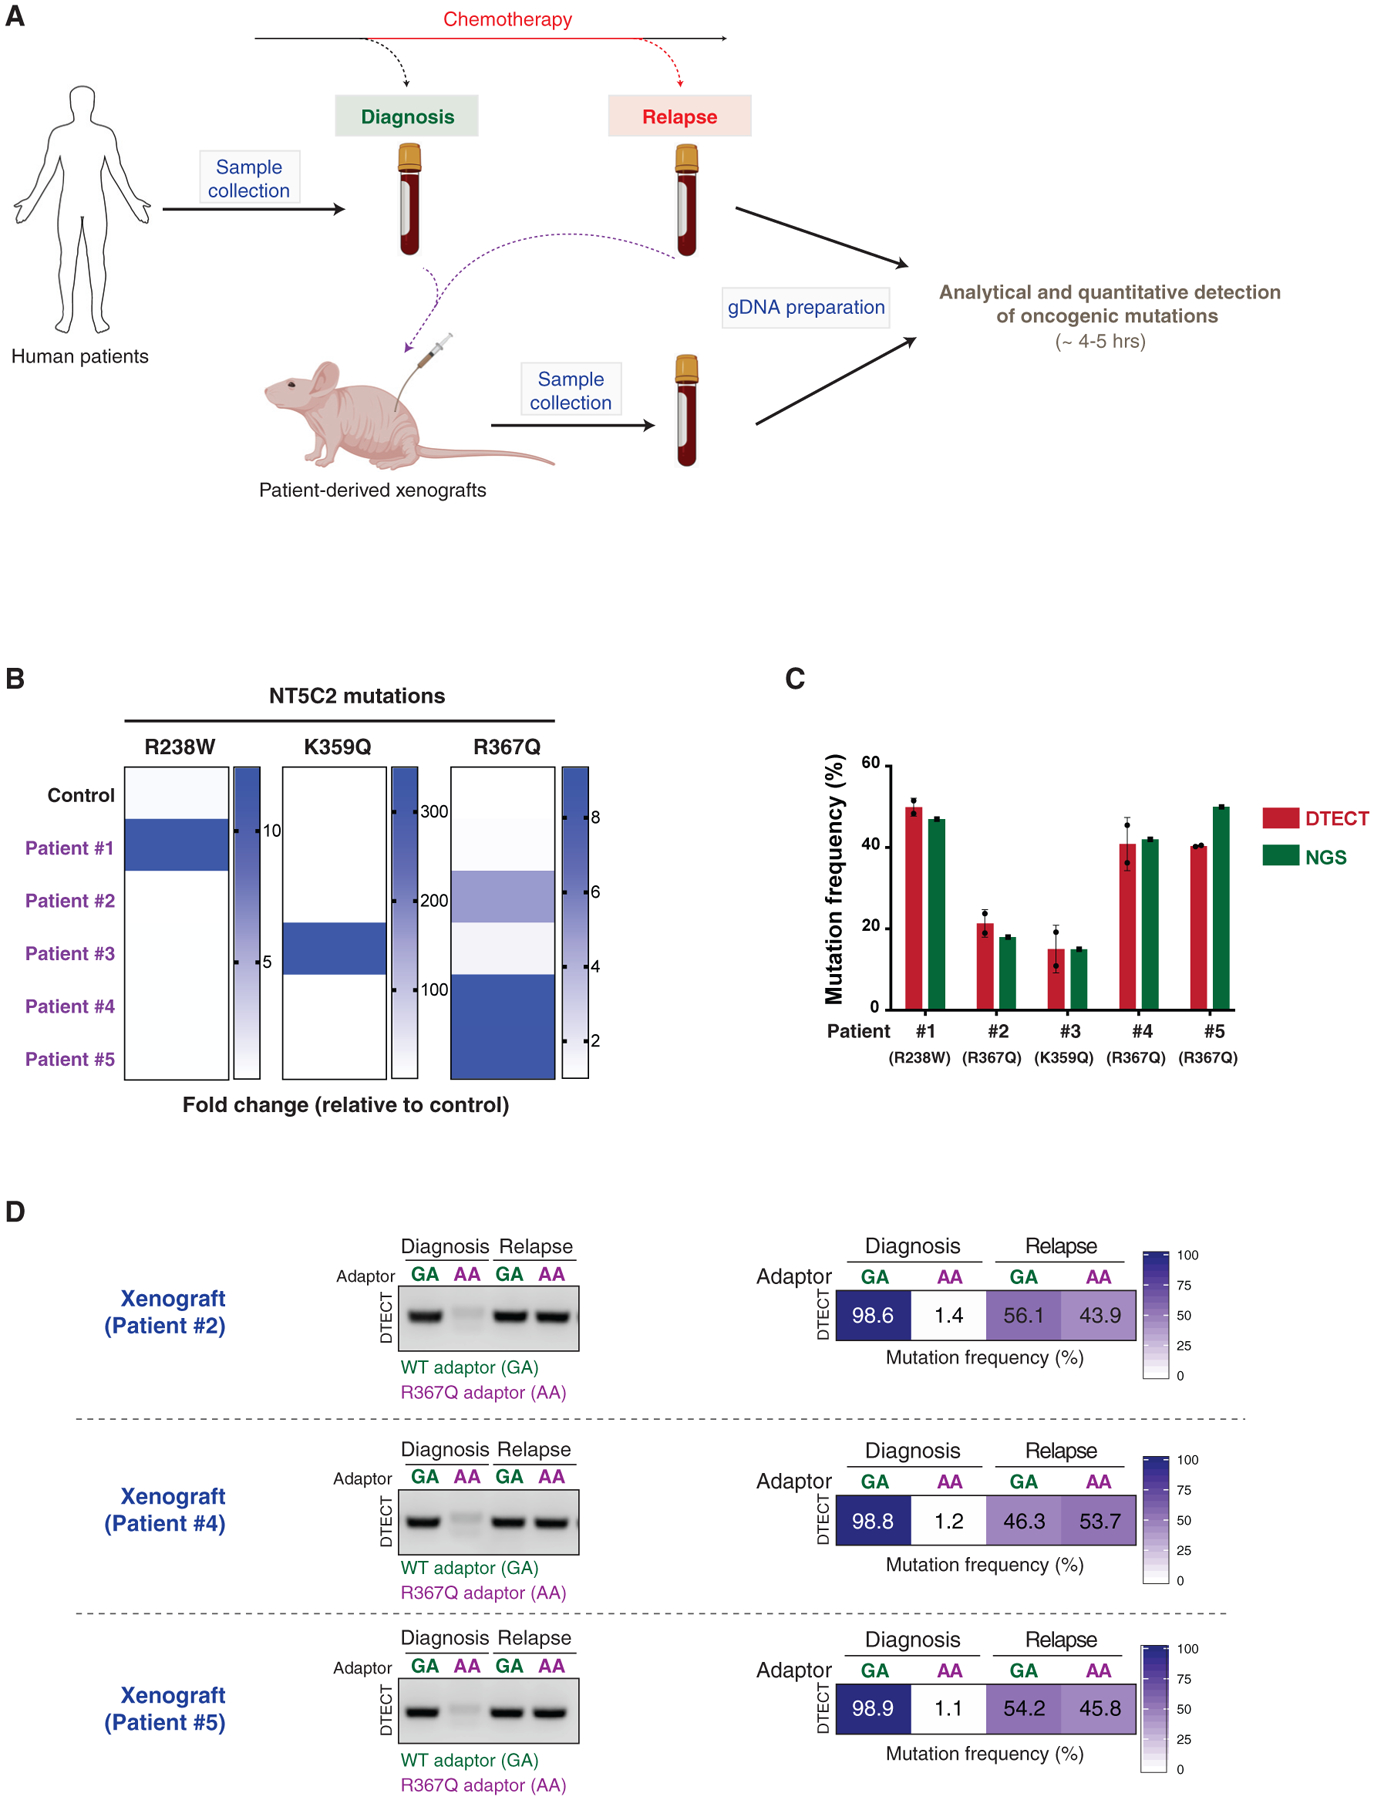
Figure 6. Detection of Oncogenic Signatures in Human Clinical Samples Using DTECT.

(A) Schematic representation of the experiments conducted on ALL patient-derived samples. Bone marrow samples from ALL patients were collected at diagnosis and after chemotherapy. PDXs were generated from the patient samples. gDNA was recovered from patient samples and PDX mouse models and subjected to analytical and quantitative detection of NT5C2 oncogenic mutations using DTECT.
(B) Heatmap showing the detection of NT5C2 oncogenic mutations in patient samples and a control sample using DTECT. Bone marrow samples from 5 patients were collected, and gDNA was prepared and tested for the presence of 3 frequent NT5C2 mutations responsible for relapse to chemotherapy. A non-patient-derived gDNA sample was used as a control to estimate the levels of non-specific background in the DTECT assay. Data are shown as fold change in the frequency of mutant signatures in the patient samples relative to the control sample.
(C) Graphical representation of the frequency of NT5C2 mutations determined by DTECT (red) and NGS (green) in the 5 human patient samples analyzed in (B). Error bars indicate the SD of 2 independent DTECT replicates.
(D) Analytical and quantitative detection of the NT5C2 R367Q mutation in PDX models generated from ALL tumors of patients 2, 4, and 5 at diagnosis and after chemotherapy relapse. WT and mutant variants were captured using adaptors specific for the WT (GA, green) or mutant (AA, purple) allele and subjected to analytical PCR (left, 18 cycles) and qPCR (right).
See also Figure S8.
