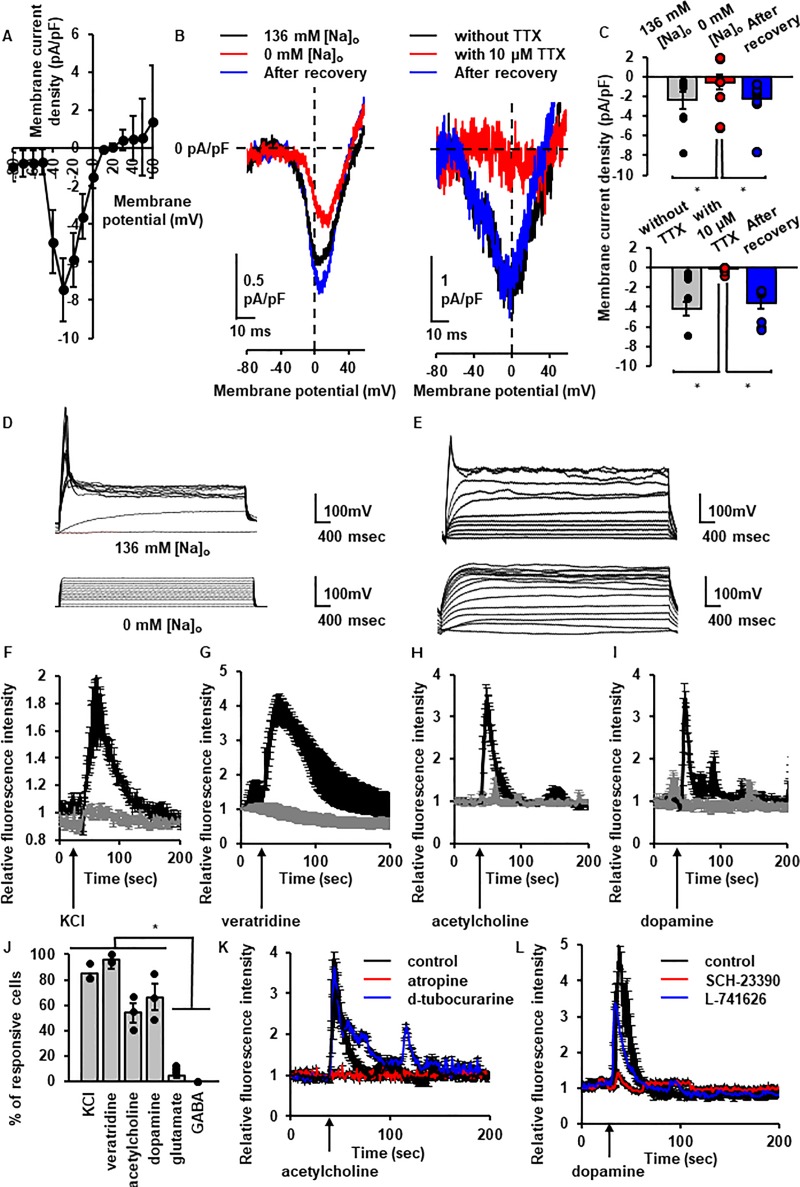
Fig 3. Electrophysiological properties and neurotransmitter response of ATRA-treated canine DFATs.
(A) Average (mean ± standard error) current-voltage relationship (I-V curves) for Na+ currents of ATRA-treated canine DFATs (n = 3) in voltage-clamp mode. (B and C) The effect of removal of extracellular Na+ (B; left panel and C; upper panel) or tetrodotoxin (B; right panel and C; lower panel) on voltage-dependent Na+ currents. Representative traces (B) and averaged membrane current density (C) were recorded using the voltage-ramp protocol. Data are shown as mean ± standard error of three independent experiments. *P < 0.05. (D and E) The effect of removal of extracellular Na+ (D) or tetrodotoxin (E) on the generation of action potential. Representative traces in the presence (D; upper panel) or absence (D; lower panel) of extracellular Na+ were recorded using the current-clamp protocol. Representative traces with (E; lower panel) or without (E; upper panel) TTX (10 μM) were recorded using the current-clamp protocol. (F to I) Changes in the intracellular Ca2+ concentration evoked by KCl (F; 50 mM), veratridine (G; 50 μM), acetylcholine (H; 1 mM), and dopamine (I; 100 μM) in cells treated with (black line) or without (gray line) ATRA. (J) The percentage of cells that responded to the indicated stimulation (n = 30, random selected ×20 fields from triplicate samples). Data are shown as mean ± standard error of three independent experiments. *P < 0.05. (K) The effect of muscarinic receptor antagonist atropine (red line; 10 μM, 5 min) and nicotinic receptor antagonist d-tubocurarine (blue line; 1 mM, 5 min) on the changes in intracellular Ca2+ concentration evoked by acetylcholine (black line; 1 mM). Data are shown as mean ± standard error of three independent experiments. (L) The effect of pretreatment (30 min) with the D1 receptor antagonist SCH-23390 (red line; 10 μM) and the D2 receptor antagonist L-741626 (blue line; 2 μM) on the changes in intracellular Ca2+ concentration evoked by dopamine (black line; 100 μM). Data are shown as the mean ± standard error of three independent experiments.

