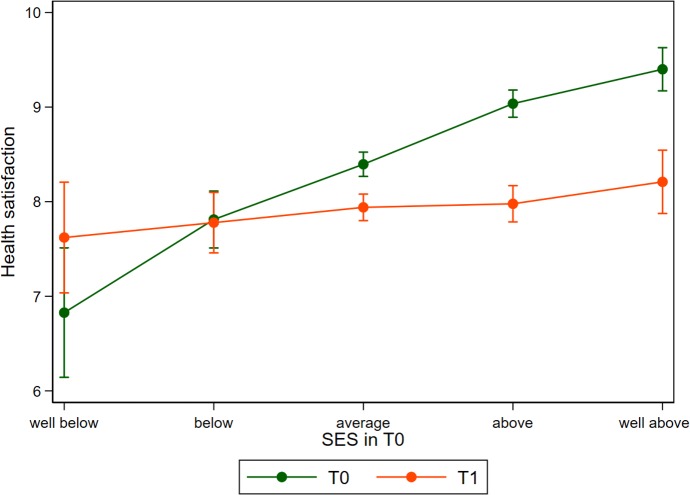
Fig 1. Health satisfaction before (T0) and after migration (T1) in relation to self-reported SES before migration.
Predictions derived from a linear model similar to column 4 of Table 3 but modelling SES as a categorical variable. Error bars indicate 95% CIs based on heteroskedastic robust standard errors clustered on the individuum. SES, socioeconomic status.

