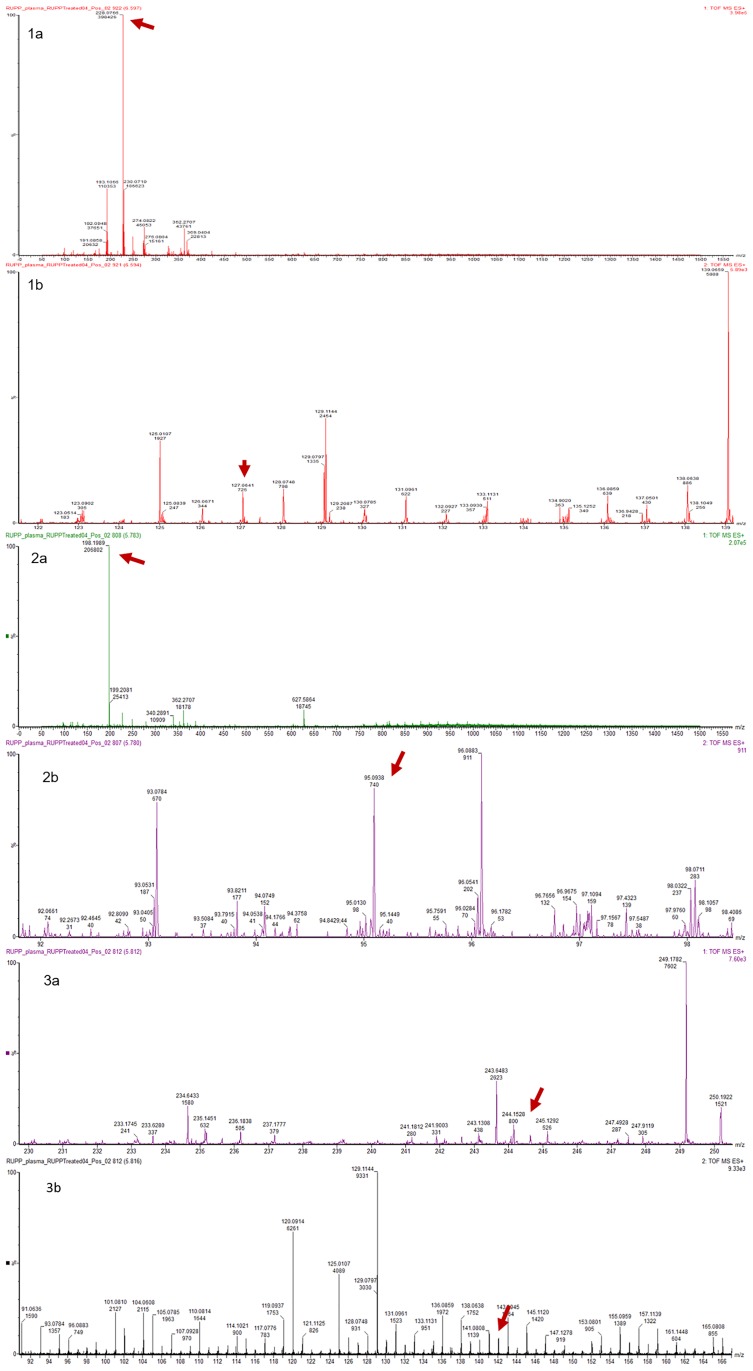
Fig 3. Mass spectra of L-Ergothioneine (1a, 1b), L-Hercynine (2a, 2b), and S-methyL-Ergothioneine (3a, 3b), detected in ESI+ mode using UPLC-Q-TOF-MS analysis.
Spectra show m/z and intensity of peaks detected. 1a: MS1 scan showing parent ion of L-Ergothioneine at 228.0766 m/z, and 1b: MS2 scan showing its product ion at 127.0641 m/z; 2a: MS1 scan showing parent ion of L-Hercynine at 198.1989 m/z, and 2b: MS2 scan showing its product ion at 95.0938 m/z; 3a: MS1 scan showing parent ion of S-methyL-Ergothioneine at 244.1528 m/z, and 3b: MS2 scan showing its product ion at 141.0808m/z.

