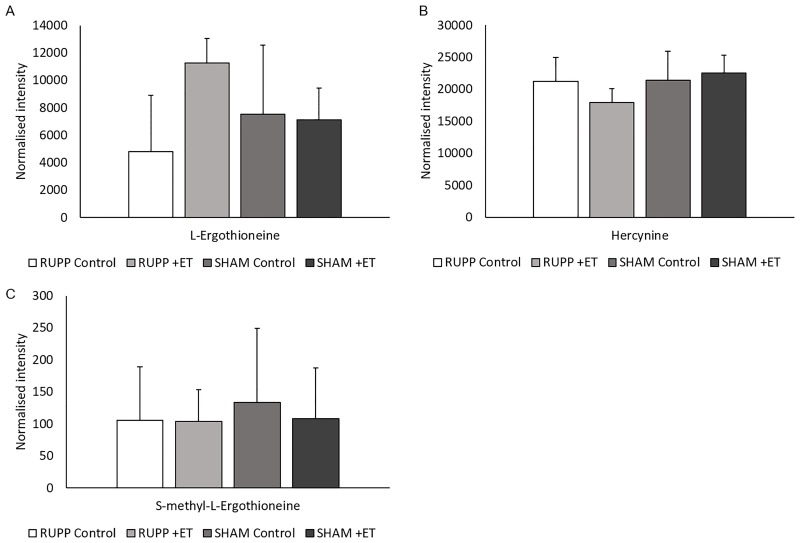
Fig 4. Plasma levels of L-Ergothioneine (A), Hercynine (B), and S-methyl- L-Ergothioneine (C).
Levels are shown as normalised intensity as detected in ESI+ UPLC-Q-TOF-MS in plasma samples of RUPP Control, RUUP +ET, Sham Control and Sham +ET groups. No significant differences in levels observed between the groups. All values are expressed with standard error.

