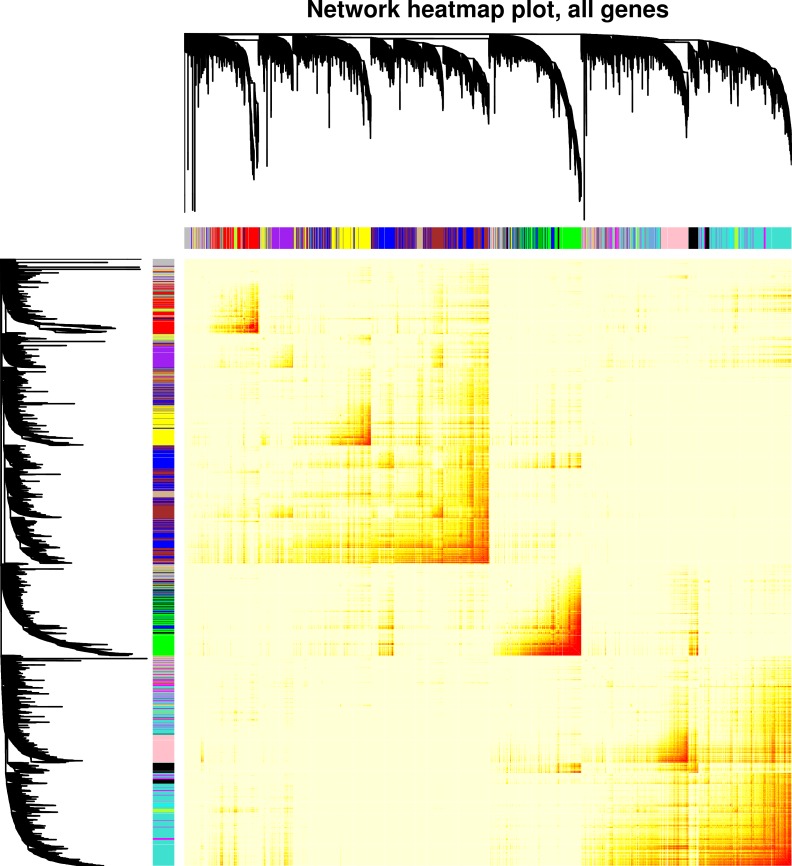
Fig 1. Visualization of the gene co-expression network modules and module relationships.
The co-expression network was built by considering all TNFa stimulated and unstimulated samples together. Hierarchical clustering dendogram of 14,019 genes expressed in HUVEC cell lines, along with colors representing module assignments. Genes that are not assigned to any module are colored grey. The heatmap shows the topological overlap matrix, and darker coloring indicates higher topological overlap.

