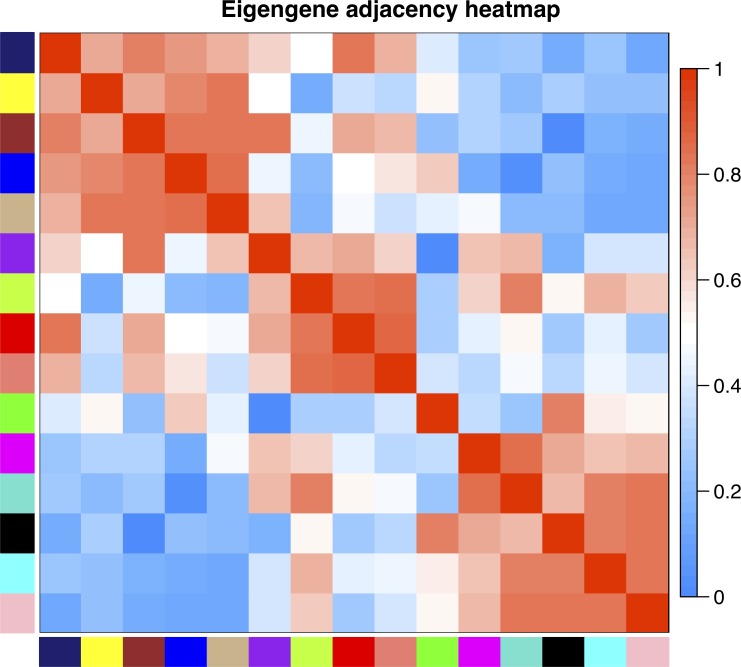
Fig 2. Adjacency heatmap showing the relationships among the module eigengenes.
Module eigengenes can be thought of as the weighted average gene expression of all genes in a module. For each pair of eigengenes EI, EJ, adjacency is calculated as (1 + cor(EI, EJ))/2. Red represents positively correlated modules and blue represents negatively correlated modules.

