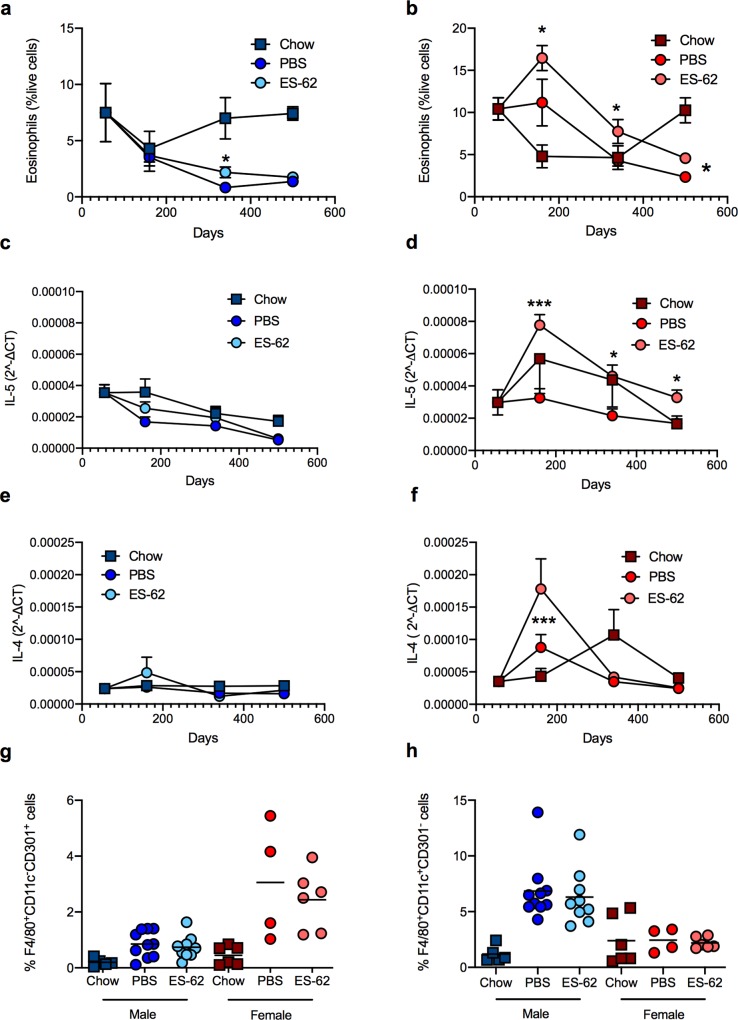
Fig 3. ES-62 modulation of eosinophil levels in gonadal fat of HCD-fed mice.
The levels of SiglecF+ eosinophils (% SVF cells) from gonadal fat of chow- and HCD- (PBS- or ES-62-treated) mice are presented as the mean values ± SEM at each time point where male (a) cohort sizes are: chow—d56, n = 5; d160, n = 3; d340, n = 6; d500, n = 5; HCD-PBS—d160, n = 10; d340, n = 11; d500, n = 6; HCD-ES-62—d160, n = 9; d340, n = 12; d500, n = 6 and female (b) cohort sizes are: chow d56—n = 6; d160, n = 6; d340, n = 6; d500, n = 5; HCD-PBS—d160, n = 4; d340, n = 11; d500, n = 6; HCD-ES-62—d160, n = 6; d340, n = 12; d500, n = 6. qRT-PCR analysis of IL-5 and IL-4 mRNA expression in gonadal fat from chow- and HCD-fed (PBS- or ES-62-treated) mice is presented (c-f) as mean 2^ΔCT values ± SEM of individual mice and the values for each mouse are means of n = 3 replicate analyses. Male cohort sizes: chow—d56, n = 6; d160, n = 5; d340, n = 6; d500, n = 5; HCD-PBS—d160, n = 10; d340, n = 11; d500, n = 6; HCD-ES-62—d160, n = 9 (IL-5), n = 10 (IL-4); d340, n = 12; d500, n = 6. Female cohort sizes: chow—d56, n = 6; d160, n = 5; d340, n = 5; d500, n = 5; HCD-PBS—d160, n = 8 (IL-4), n = 9 (IL-5) d340, n = 11; d500, n = 6; HCD-ES-62—d160, n = 9 (IL-4), n = 10 (IL-5); d340, n = 11; d500, n = 6. The levels of F4/80+CD11c-CD301+ (g) and F4/80+CD11c+Cd301- (h) macrophages in gonadal fat in male and female chow- and HCD- (PBS- or ES-62-treated) mice in the d160 cohorts are shown. For clarity, only significant differences between the HCD-PBS and HCD-ES-62 cohorts are shown on the figures, where significance is denoted by *p < 0.05 and ***p < 0.001.

