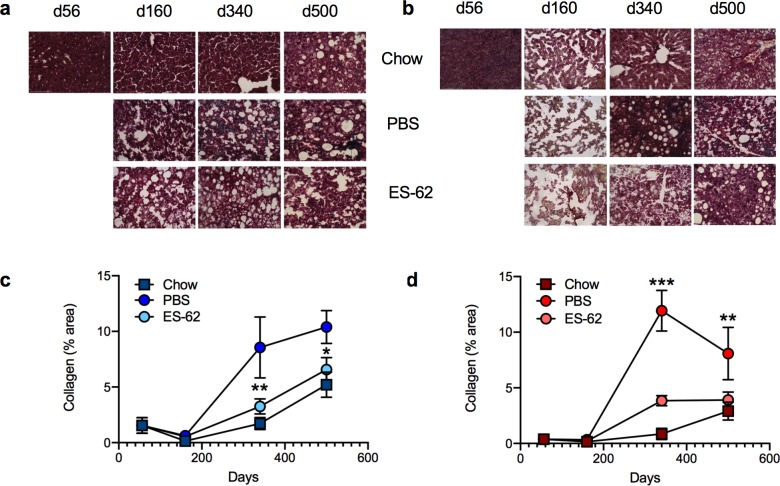
Fig 4. Effect of ES-62 on liver fibrosis in HCD-fed mice.
Representative images (scale bar 100 μm) of liver from male (a) and female (b) mice stained with Gömöri’s Trichrome: quantitative analysis of collagen deposition is presented as mean (of triplicate analyses) values ± SEM, where n = 5–6 individual male (c) and female (d) mice. Significant differences between the HCD-PBS and HCD-ES-62 cohorts are shown where *p < 0.05, **p < 0.01 and ***p < 0.001.

