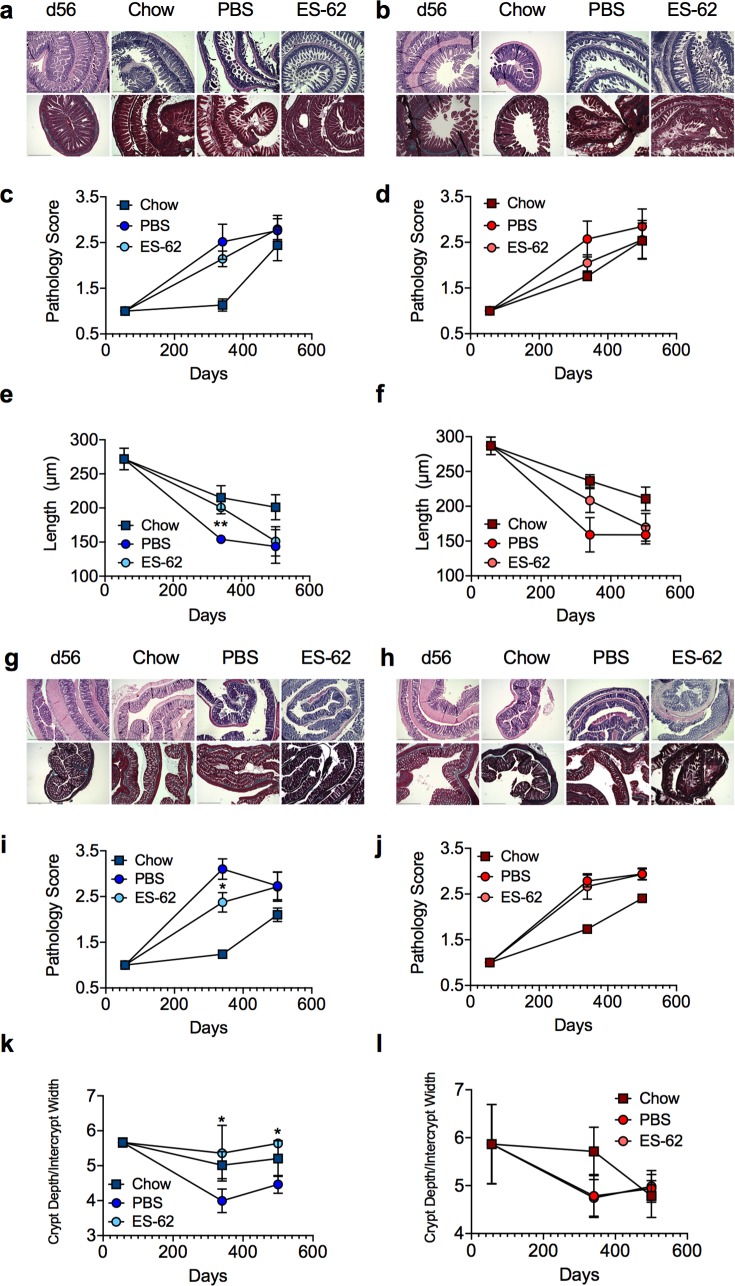
Fig 5. ES-62 protects against gut pathology in HCD-fed mice.
Representative images (scale bar 500 μm) of ileum tissue from male (a) and female (b) d56 (chow-fed) and d340 chow- and HCD- (PBS- or ES-62-treated) mice stained with H & E (upper panels) and Gömöri’s Trichrome (lower panels) and resultant pathology scoring (c, d) and quantitative analysis of ileum villus length (e, f) are shown. Data are presented as the mean values ± SEM where n = 4–6 individual male (a, c, e) and female (b, d, f) mice at each time point and the values for each mouse are means derived from n = 3 replicate analyses. Representative images (scale bar 500 μm) of colon tissue from male (g) and female (h) d56 (chow-fed) and d340 chow- and HCD- (PBS- or ES-62-treated) mice stained with H & E (upper panels) and Gömöri’s Trichrome (lower panels) and resultant pathology scoring (i, j) and quantitative analysis of the ratio of crypt depth:intercrypt width (k, l) are shown. Data are presented as the mean values ± SEM where n = 4–6 individual male (g, i, k) and female (h, j, l) mice at each time point and the values for each mouse are means derived from n = 3 replicate analyses. For clarity, only significant differences between the HCD-PBS and HCD-ES-62 cohorts are shown on the figures, where significance is denoted by *p < 0.05 and **p < 0.01.

