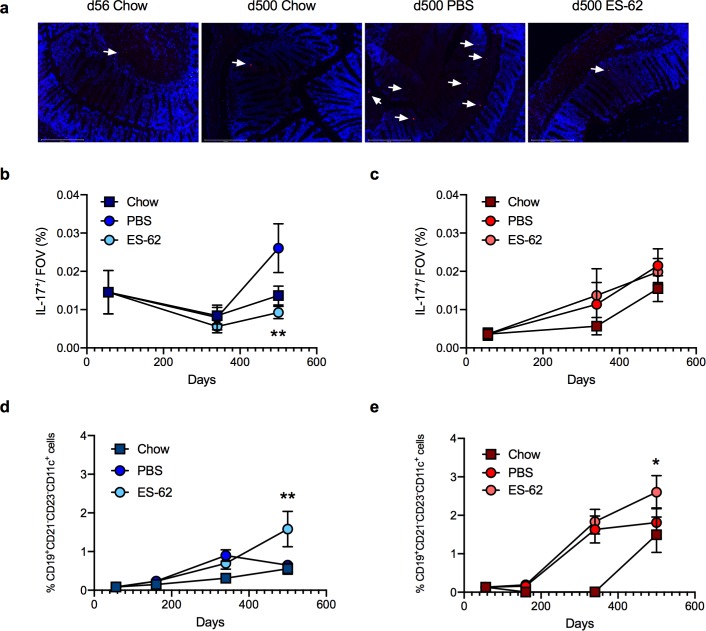
Fig 6. ES-62 modulates colon IL-17 and ageing-associated B cell responses in HCD mice.
Representative images (a; scale bar 200 μm; d500) and quantitative analysis (b, c) of colon IL-17-expression (red, indicated by arrows; DAPI counterstain, blue): data represent mean (of triplicate analyses) values ± SEM, where n = 4–6 individual mice per time point. Splenic CD19+CD21-CD23-CD11c+ B cells (% live cells) presented as mean values ± SEM where male (d) cohort sizes: chow—d56, n = 6; d160, n = 6; d340, n = 6; d500, n = 5; HCD-PBS—d160, n = 6; d340, n = 7; d500, n = 6; HCD-ES-62—d160, n = 6; d340, n = 8; d500, n = 6 and female (e) cohort sizes: chow—d56, n = 5; d160, n = 6; d340, n = 6; d500, n = 3; HCD-PBS—d160, n = 9; d340, n = 11; d500, n = 6; HCD-ES-62—d160, n = 10; d340, n = 12; d500, n = 6. Significant differences between HCD-PBS and HCD-ES-62 cohorts are shown where *p < 0.05 and **p < 0.01.

