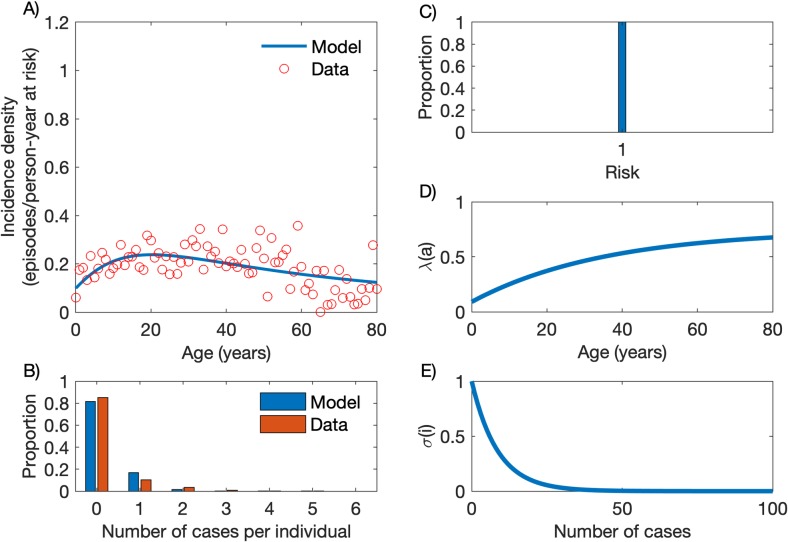
Fig 1. Model with homogeneous risk.
(A) Age-specific malaria incidence data (red circles) and the best fitting model output (blue line). (B) Frequency distribution of the number of cases per person, empirical data (red bars) and model output (blue bars). (C) Homogeneous risk distribution. (D) Age-dependent force of infection (Eq 1) with parameters λ0 = 0.7452, c = 0.8787 and k = 0.0282. (E) Partial immunity factor (Eq 2) with parameter α = 0.1162.

