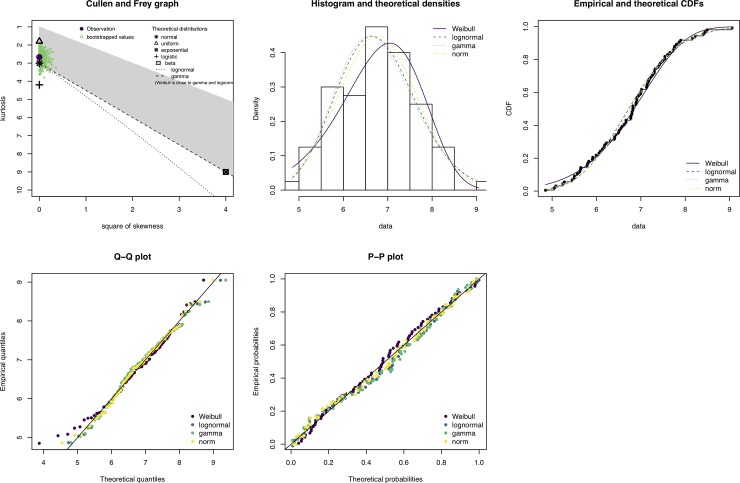
Fig 2. The output of a CAMPP data check.
The gene used in this example is FAM27E2, randomly selected from the ten variable check plots. Top panel from the left; Cullen and Frey graph showing skewness and kurtosis of normalized and transformed expression data and histogram with different distribution models overlayed. Lower panel from left, quantile-quantile, and probability-probability plot.

