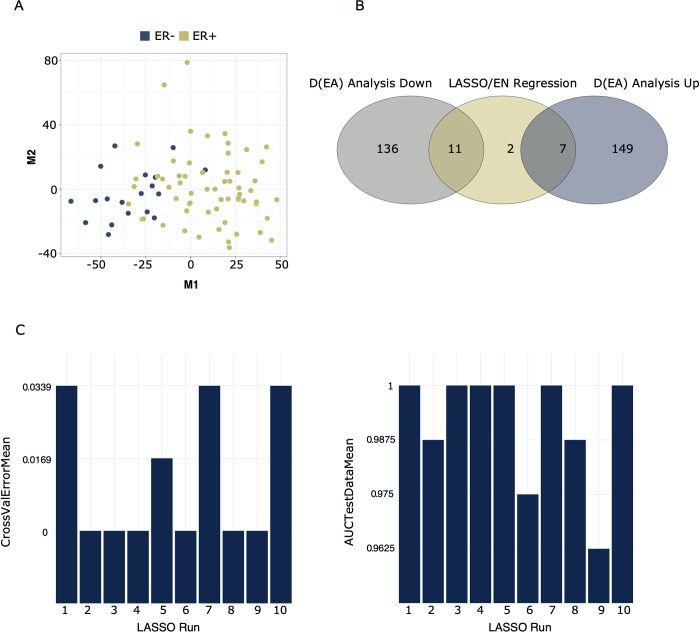
Fig 3. Results of gene selection using DEA and elastic-net regression.
The dataset contained ~ 15.000 genes and 80 samples, groups used for contrast were estrogen positive (n = 61) vs estrogen negative samples (n = 19). Fig 3A is a multidimensional scaling plot showing the partitioning of samples (based on all genes), colored by estrogen status. Fig 3B shows the overlap of results from elastic-net regression (alpha = 0.5) and differential expression analysis with significance cutoffs logFC > 1 or < -1 and FDR < 0.05. Fig 3C depicts the performance statistics for elastic-net regression, e.g., 10-fold cross-validation errors and area under the curve (AUC) scores for the test set. Elastic-net is run 10 times with different random seeds.

