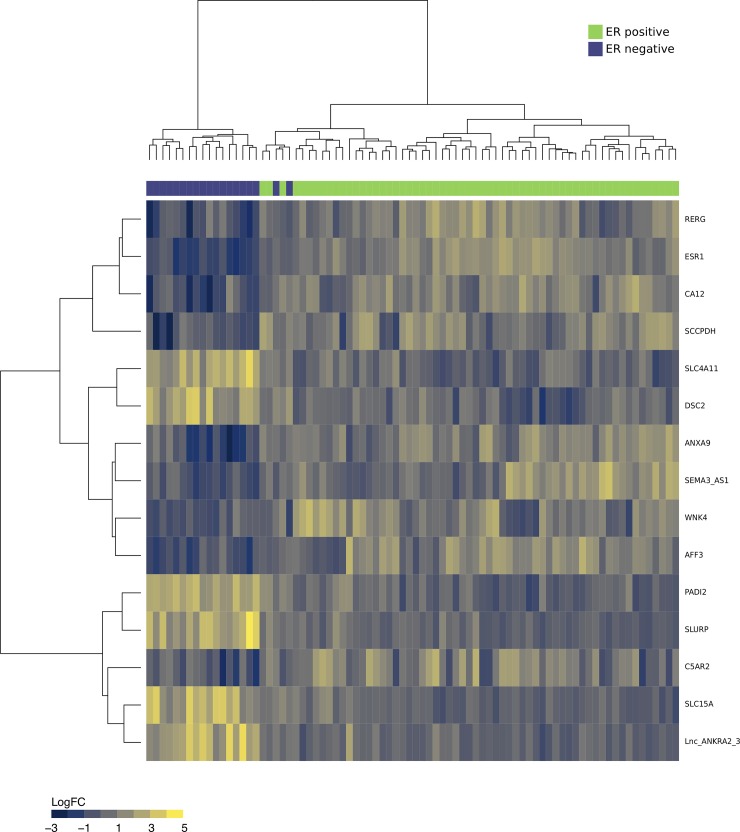
Fig 4. The heatmap in Fig 4 shows the partitioning breast cancer tissues into estrogen receptor-positive (ER+) samples and estrogen receptor-negative (ER-) samples, based on the consensus set of variables from differential expression analysis and elastic-net regression.
Green = ER+ samples and Purple = ER- samples. Color scale of heatmap (blue to yellow) denotes log2 fold change.

