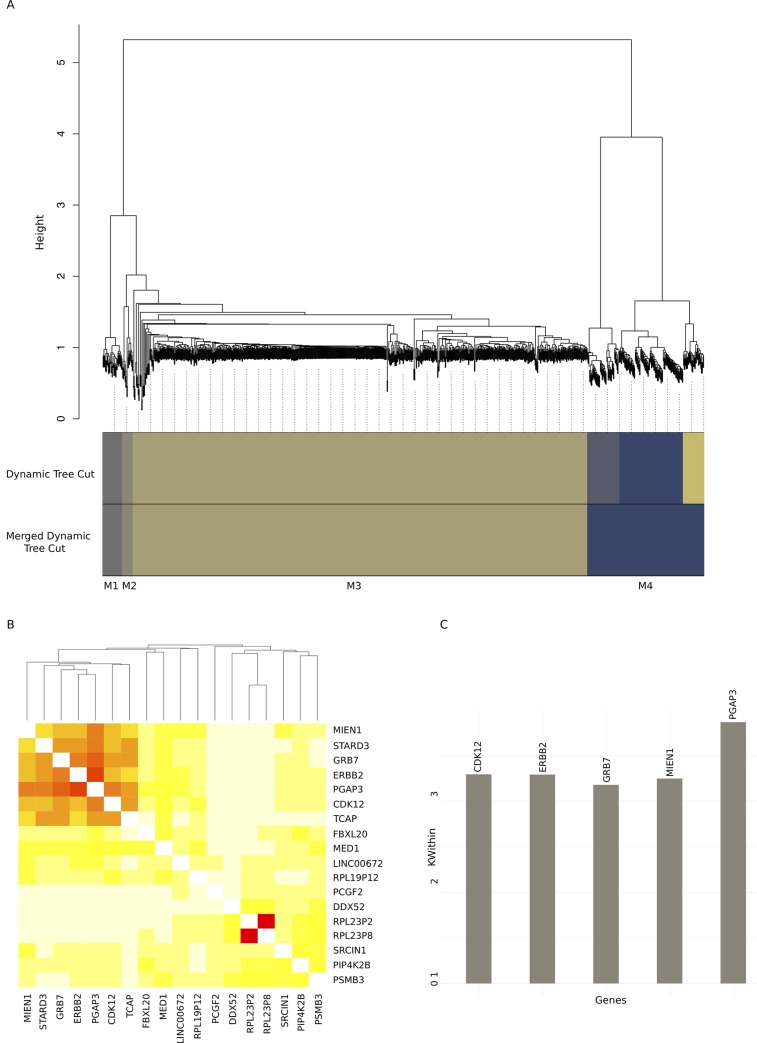
Fig 5. Results of Weighted Gene Co-expression Network Analysis on dataset of ~ 15.000 genes and 80 samples.
As the dataset contained more than 5000 variables, WGCNA was performed in a block-wise manner to save computational time, in accordance with the WGCNA reference manual [44]. Fig 5A shows the module clustering tree for the first block as an example. Fig 5B depicts the co-expression heatmap for the small module 2, in which a set of six genes display highly correlated expression patterns. Fig 5C contains the top 25% (in this case five) most interconnected genes from the small module 2, with module interconnectivity scores.

