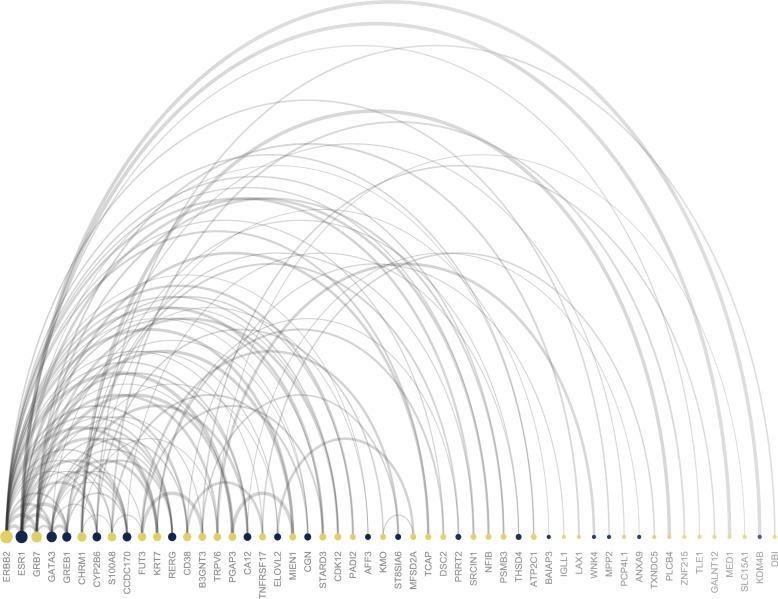
Fig 6. Plot showing the top 100 best protein-protein (gene-gene) interaction pairs from the analysis of HER2-enriched vs Luminal A samples.
Colors denote the log fold change of a gene; yellow = up-regulated and blue = down-regulated. The size of the node shows the absolute log fold change, while the ordering from left to right denotes the degree of node interconnectivity. The width of the arch represents the interaction score from the STRING database.

