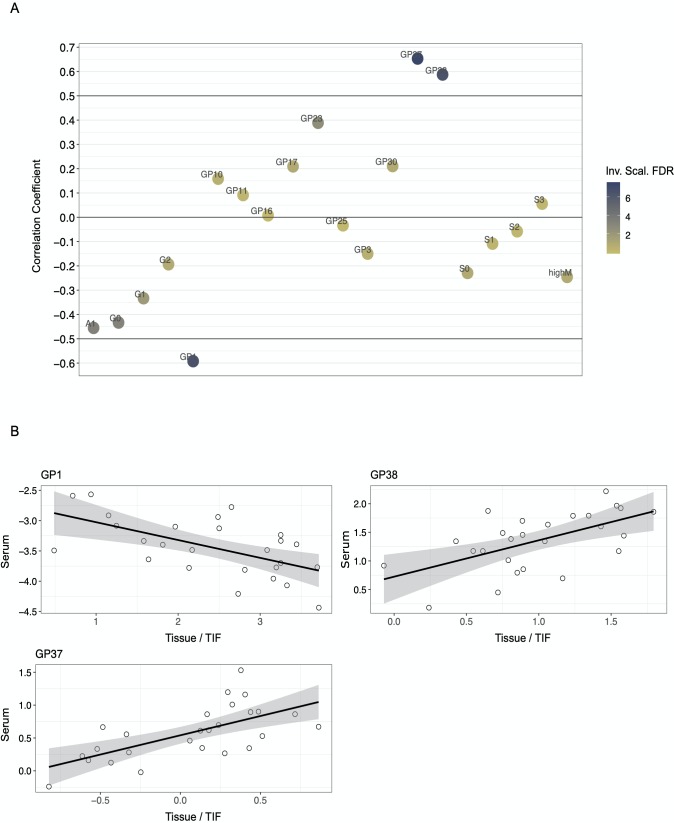
Fig 7. Results of correlation analysis with N-glycan abundances in interstitial fluids and paired serum samples.
Dataset contained a total of 103 samples (51 normal interstitial fluids and 52 tumor interstitial fluids) with ~70 N-glycan groups (165 N-glycans). Fig 7A shows the correlation scores for differentially abundant N-glycan groups, three of these, GP1, GP37, and GP38 met the requirement for significance (corr > 0.5 and fdr < 0.05), y-axis = Spearman correlation coefficient. Fig 7B shows the individual correlation plots for the three significant N-glycan groups, x-axis = tumor interstitial fluid abundance and y-axis = serum abundance.

