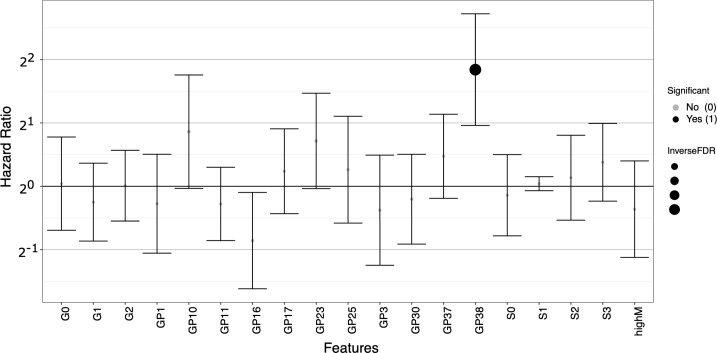
Fig 8. Results of survival analysis (cox-proportional hazard regression) with correction for patient age at diagnosis and tumor infiltrating lymphocyte status (TILs).
Survival analysis was run on the set of differentially expressed N-glycan groups. Only one N-glycan, GP38, was significant after correction for multiple testing. Hazard ratios are displayed on a log2 scale with confidence intervals, x-axis = N-glycan groups, and y-axis = log2 hazard ratio.

