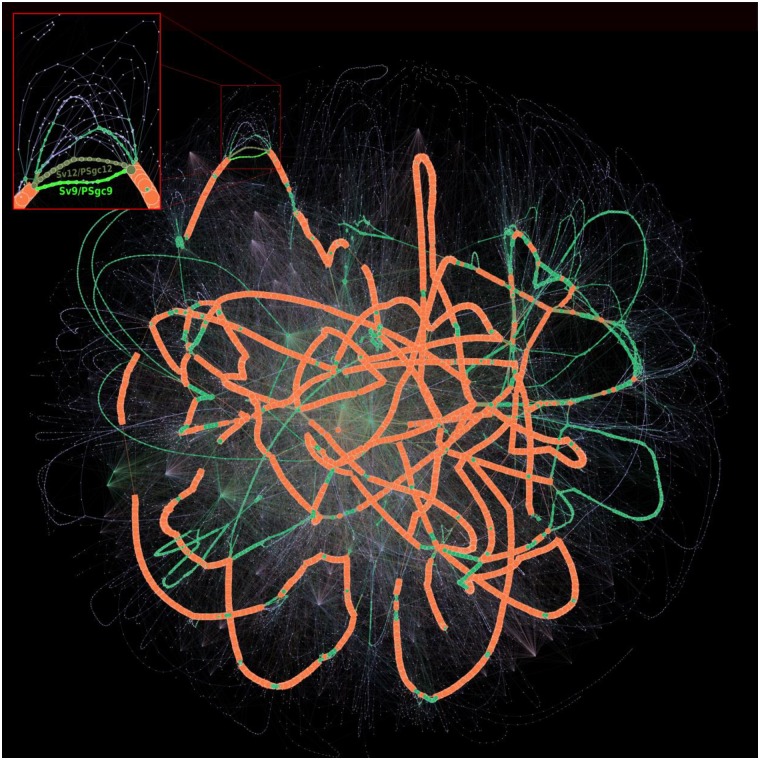
Fig 2. Partitioned pangenome graph of 3 117 Acinetobacter baumannii genomes.
This partitioned pangenome graph of PPanGGOLiN displays the overall genomic diversity of 3 117 Acinetobacter baumannii strains from GenBank. Edges correspond to genomic colocalization and nodes correspond to gene families. The thickness of the edges is proportional to the number of genomes sharing that link. The size of the nodes is proportional to the total number of genes in each family. The edges between persistent, shell and cloud nodes are colored in orange, green and blue, respectively. Nodes are colored in the same way. The edges between gene families belonging to different partitions are shown in mixed colors. For visualization purposes, gene families with less than 20 genes are not shown on this figure although they comprise 84.68% of the nodes (families mostly composed of a single gene). The frame in the upper left corner shows a zoom on a branching region where multiple alternative shell and cloud paths are present in the species. This region is involved in the synthesis of the major polysaccharide antigen of A. baumannii. The two most frequent paths (Sv12/PSgc12 and Sv9/PSgc9) are highlighted in khaki and fluo green. The Gephi software (https://gephi.org) [32] with the ForceAtlas2 algorithm [33] was used to compute the graph layout with the following parameters: Scaling = 8000, Stronger Gravity = True, Gravity = 4.0, Edge Weight influence = 1.3.

