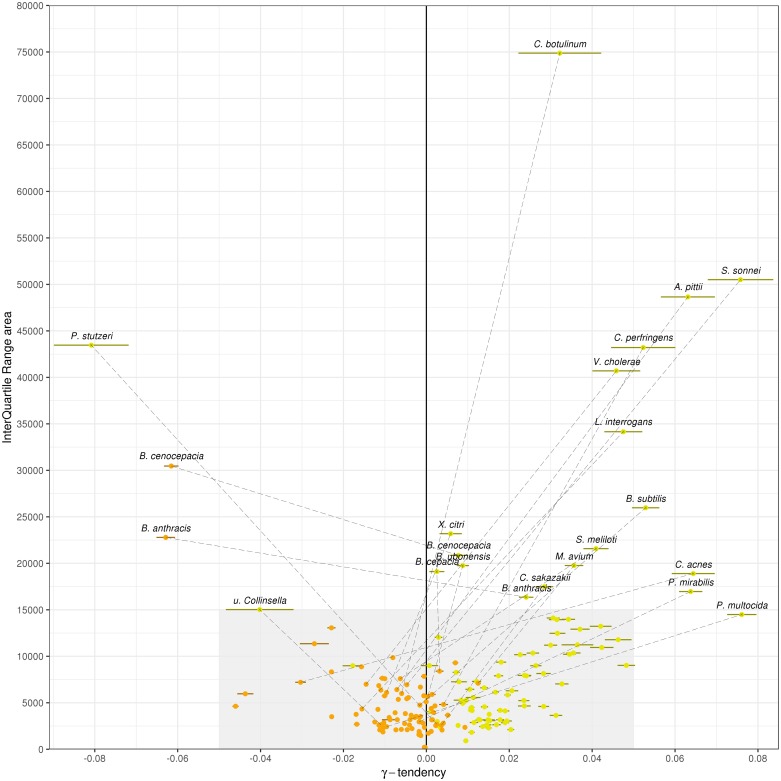
Fig 4. γ-tendencies and IQR areas of the persistent and the soft core rarefaction curves.
Each of the 88 most abundant species in GenBank are represented by two points: orange points correspond to the PPanGGOLiN persistent values and yellow points to the ones of the soft core (⩾95% of presence). A dashed line connects the 2 points if either the soft core or the persistent values are not in the range of the grey area (−0.05 ⩽ γ ⩽ 0.05 and 0 ⩽ IQRarea ⩽ 15000). The colored horizontal bars show the standard errors of the fitting of rarefaction curves via the Heaps’ law.

