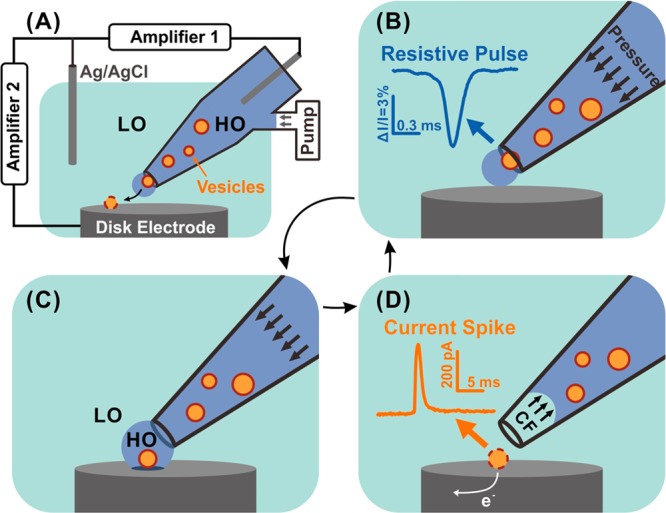
Figure 1.

Schematic of RP-VIEC. (A) electrode configuration for RP-VIEC. Amplifier 1 records the RP at a potential of +13 mV vs Ag/AgCl reference electrode. Amplifier 2 records the current spike for VIEC with electrode potential set to +700 mV vs the same reference electrode. (B–D) Schematics showing a cycle induced by periodic pressure: (B) Pressure is applied to push a vesicle across the nanopore and generate an RP signal. (C) The vesicle attaches on the electrode surface and is surrounded by the outflowing buffer with relatively high osmolality (similar to vesicular lumen). LO, low osmolarity; HO, high osmolality. (D) Suspended pressure results in capillary force (CF) stopping solution outflow. The vesicle on the surface opens by electroporation aided by the relatively low osmolarity of the surrounding solution. Electroactive content of the vesicle is electrooxidized and generates a current spike.
