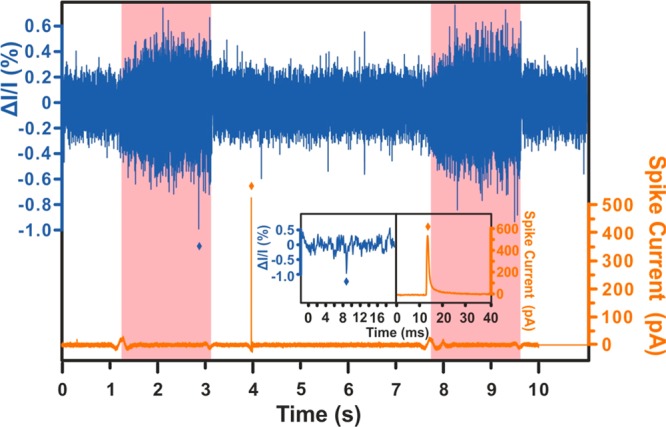
Figure 2.

An example an RP vs VIEC signal. The blue trace is the RP recording and it is shown in the form of normalized current decline, and the orange trace is VIEC and shown as spike current. The data from both traces are processed (raw traces in SI, Figure S3). The inset is the magnification of both signals, including a RP signal and its following VIEC signal (marked with an asterisk for each). The pink zones indicate when the pressure is applied, and white zones indicate when it is stopped. RP spikes in the white zone without corresponding VIEC signals are likely due to dust or other particles that do not impact or create a signal at the electrode and so are not considered.
