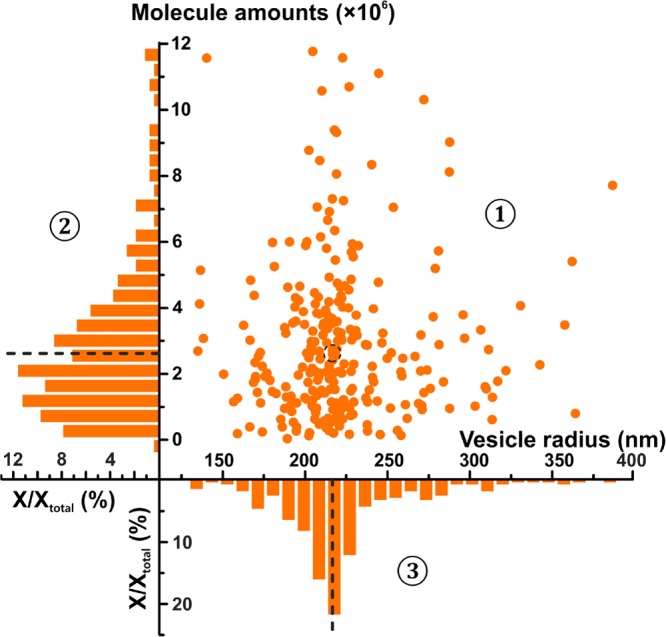
Figure 3.

Statistical distribution of vesicle content versus radius of each individual recorded chromaffin vesicle. The relationship between content versus radius is shown in a scatter plot in part ①; the normalized frequency histograms of content are depicted in part ② and vesicle radius in part ③. Parts ① and ② share the Y-axis, and parts ① and ③ share the X-axis. The dotted lines and circle indicate the median position for each parameter measured.
