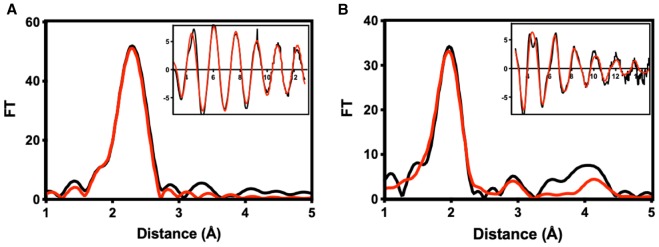
Figure 4. EXAFS spectra of fully reduced and fully oxidized Vc H-NOX.
Zn K EXAFS and Fourier transforms of reduced (A) and oxidized (B) H-NOX. Black traces represent experimental data and red traces are simulations. Parameters used to generate the simulated spectra are listed in Table 2.

