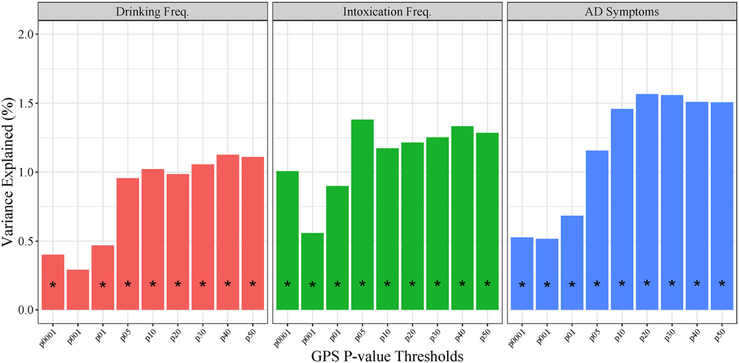
Figure 1.
Predictive power of genome-wide association studies (GWAS) and Sequencing Consortium of Alcohol and Nicotine Use (GSCAN) polygenic scores. Vertical bars represent change in model R2 from base model (age and sex as covariates) to model including polygenic scores at various P-value inclusion thresholds (determined by P-value from discovery GWAS) for drinking frequency (left), intoxication frequency (center), and alcohol dependence symptoms (right). *Association P< 0.05.

