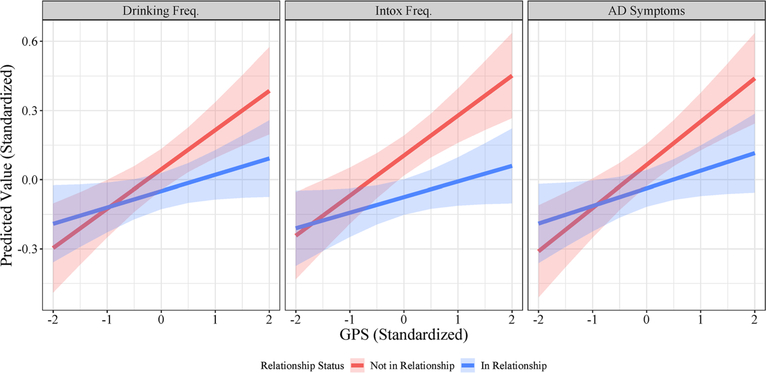
Figure 2.
Gene–environment interaction across relationship status and polygenic risk. Standardized predicted values of drinking frequency (left), intoxication frequency (center), and alcohol dependence symptoms (right) across the observed range of polygenic scores for those in a relationship (blue) and those not in a relationship (red). Shaded areas represent 95% pointwise confidence intervals of estimates.

