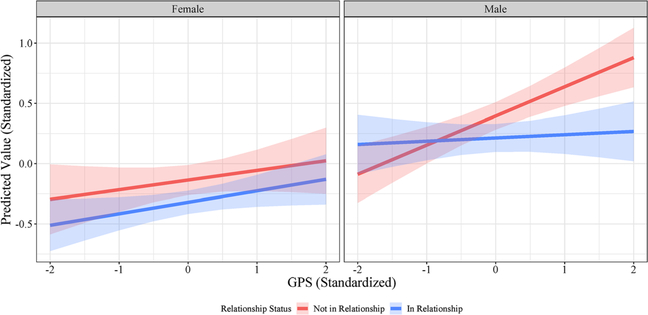
Figure 3.
Sex differences in G × E for intoxication frequency. Predicted values of intoxication frequency (standardized) for females (left) and males (right) across the observed range of polygenic scores and sex for those in a relationship (blue) and those not in a relationship (red). Shaded areas represent 95% pointwise confidence intervals of estimates.

