
Figure 5. Changes in key metabolite levels correlate with changes in HIF-lα protein and histone methylation.
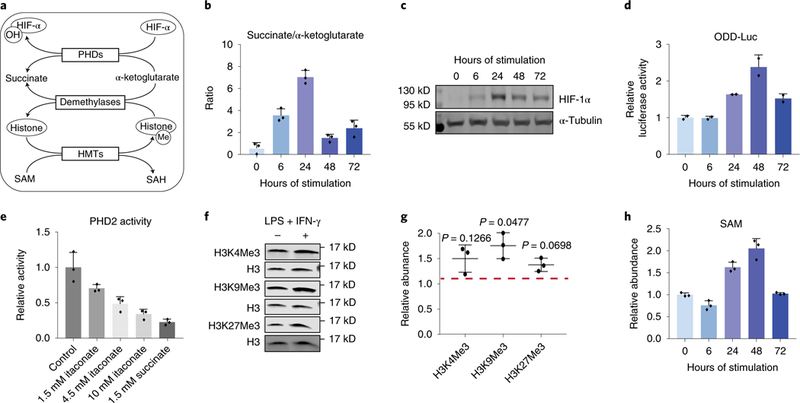
a. The role of key metabolites in regulating HIF-1α and histone methylation. HIF-lα can be hydroxylated by PHDs, using α-ketoglutarate as the substrate and producing succinate. Hydroxylated HIF-lα is then targeted for degradation. The level of histone methylation is controlled by the competing actions of histone methyltransferases (HMTs) and demethylases. HMTs require S-adenosyl-L-methionine (SAM) as the methyl donor. Demethylation by the JmjC family of demethylases uses α-ketoglutarate as the substrate and produces succinate.
b. Ratio of intracellular succinate to α-ketoglutarate in BMDM stimulated with LPS and IFN-γ for indicated time. Bar graph with error bar represents mean + SD (n=3 independent samples), dots represent individual values.
c. HIF-la protein levels in BMDMs stimulated with LPS and IFN-γ for time indicated. Similar results were observed in at least 6 independent experiments.
d. Luciferase activity measured in BMDMs derived from ODD-luc mice after stimulation with LPS and IFN-γ for indicated time. Data were normalized to protein content and expressed relative to the activity in unstimulated (0h) BMDMs. Bar graph with error bar represents mean + SD (n=2 independent samples), dots represent individual values.
e. Activity of recombinant human PHD2 in the presence of itaconate or succinate of indicated concentration. Bar graph with error bar represents mean + SD (n=3 independent samples), dots represent individual values.
f. Representative western blot of histone trimethylation marks in BMDMs stimulated with LPS and IFN-γ for 24h. Experiments were performed independently three times, and quantitation of all these blots is represented in g. Relative abundance of indicated histone trimethylation was first normalized to total H3 level, then expressed as relative change compared to unstimulated BMDMs. Center value with error bar represents mean ± standard deviation (n=3 independent samples), dots represent individual values. p-value was determined via one-sample t-test (H0: μ=1; two tailed).
h. Relative abundance of intracellular SAM in BMDMs after stimulated with LPS and IFN-γ for indicated time. Bar graph with error bar represents mean + SD (n=3 independent samples), dots represent individual values.