
Figure 7. Alternative substrate utilization in LPS and IFN-γ stimulated macrophages.
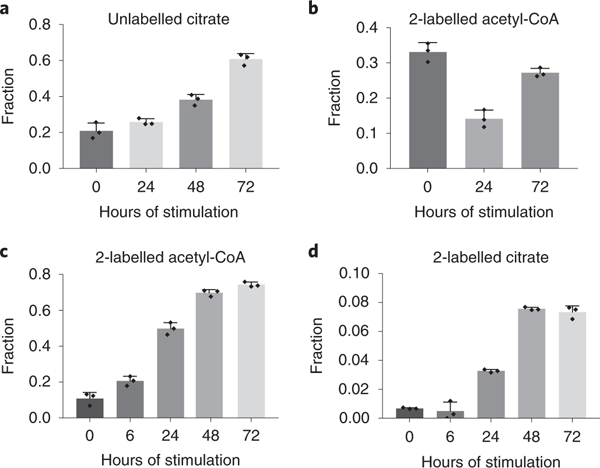
a. Fraction of citrate that remains unlabeled in RAW 264.7 cells stimulated with LPS and IFN-γ for indicated time, after 24h incubation with both U-13C-glucose and U-13C15N-glutamine. Bar graph with error bar represents mean + SD (n=3 independent samples), dots represent individual values.
b. Fraction of 2-labeled acetyl-CoA in RAW 264.7 cells stimulated with LPS and IFN-γ for indicated time, after 24h incubation with 40μM BSA-conjugated U-13C-palmitic acid. Bar graph with error bar represents mean + SD (n=3 independent samples), dots represent individual values.
c,d. Fraction of 2-labeled acetyl-CoA (c) and citrate (d) in RAW 264.7 cells stimulated with LPS and IFN-γ for indicated time, after 24h incubation with 500μM U-13C-acetate. Bar graph with error bar represents mean + SD (n=3 independent samples), dots represent individual values.