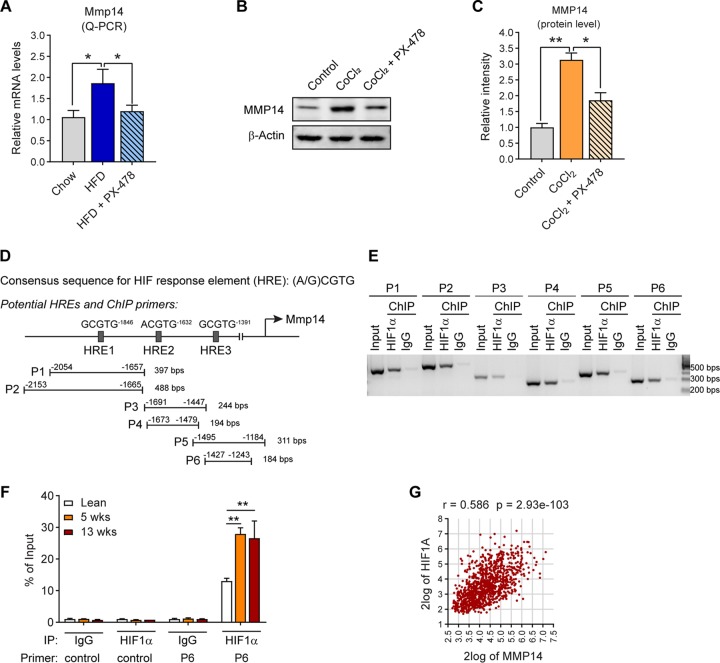
FIG 2.
MMP14 is upregulated by HIF1α in obese adipose tissue. (A) Q-PCR analysis of Mmp14 in the eWAT of WT mice that were fed on regular chow diet, HFD, or HFD plus PX-478 (HIF1α inhibitor) for 5 weeks (n = 5 per group, one-way ANOVA; *, P < 0.05). (B) Western blotting of MMP14 in PC3 cells treated with CoCl2 (100 μM) in the presence or absence of PX-478 (30 μM; representative of three trials). (C) Quantification of the band density for the Western blotting in panel B (n = 3 per group, one-way ANOVA; *, P < 0.05; **, P < 0.01). (D) Schematic diagram showing the three potential HIF response elements (HREs) in the 2,000 bp upstream sequence of the mouse Mmp14 gene. Six pairs of ChIP primers were designed to probe the different regions containing the potential HREs. The sizes of predicted products of ChIP-PCR assay are indicated at the end of each primer. (E) Semiquantitative PCR analysis of ChIP assay in hypoxia PC3 cells using the primers indicated in panel D and the DNA templates immunoprecipitated by anti-HIF1α antibody or IgG (negative control). (F) Q- PCR analysis of ChIP assay in the eWAT of lean, 5-week, and 18-week HFD-fed mice. The Q-PCR analysis was performed against the DNA templates immunoprecipitated by anti-HIF1α antibody or IgG with the control and P6 primers as indicated in panel D. The data are presented as the percentages of immunoprecipitation input for each sample (representative of three trials, n = 3 per group, one-way ANOVA; **, P < 0.01). (G) Correlation analysis between MMP14 and HIF1A genes in the public breast tumor data set (n = 1110) using genomics analysis and the visualization platform R2. The correlation coefficient r value and the significance P value were autocalculated by the platform.

