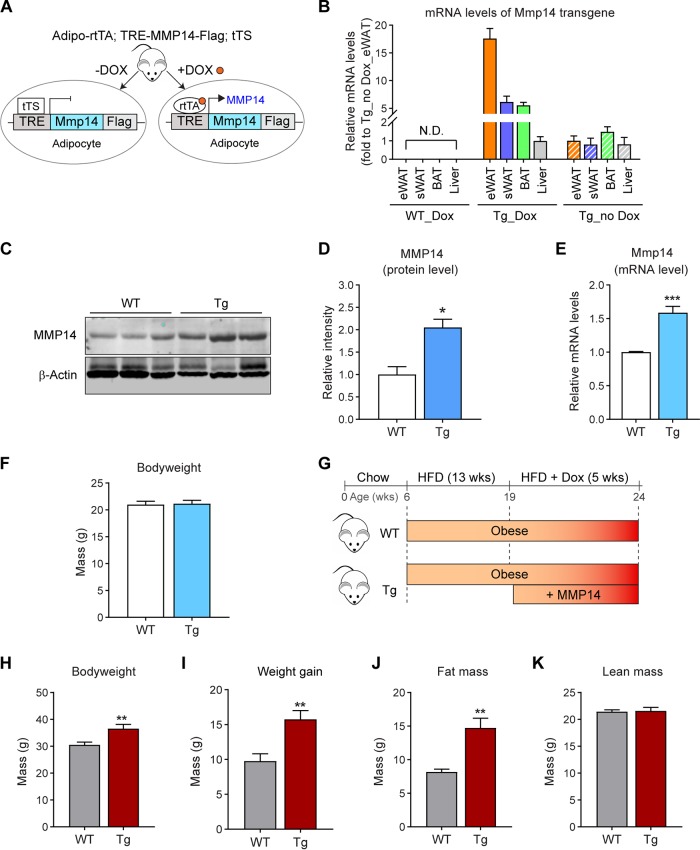
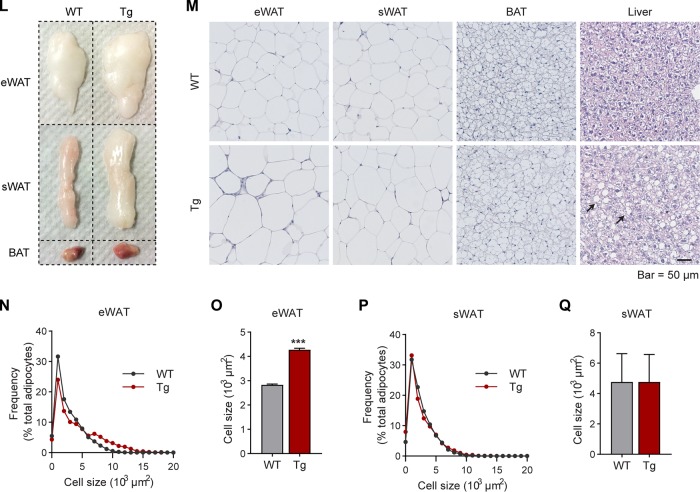
FIG 3.
Inducible overexpression of MMP14 in established obese adipose tissue leads to increased body weight, larger adipose tissue, and fatty liver. (A) Newly generated mouse model for Dox-inducible adipocyte-specific overexpression of MMP14. Mice carrying triple transgenes (Adipo-rtTA; TRE-Mmp14-flag; tTS) were used as MMP14 Tg mice, while their littermates carrying Adipo-rtTA only were used as WT controls. (B) Q-PCR analysis of the Mmp14 transgene in different tissues of MMP14 Tg and WT mice that were fed with or without doxycycline (Dox; 200 mg/kg regular chow diet) for 1 week. The primer pair for the Q-PCR analysis specifically recognized the transgenic Mmp14 but not endogenous Mmp14 by probing the Flag tag at the 3′ end of transgenic Mmp14 (n = 3 per group). (C) Western blotting of MMP14 in the eWAT of MMP14 Tg and WT mice fed on Dox (200 mg/kg regular chow diet) for 1 week (n = 6 per group, representative of three trials). (D) Quantification of the band density for the Western blotting in panel C (n = 6 per group, Student t test; *, P < 0.05). (E) Q-PCR analysis of the Mmp14 gene in the eWAT of MMP14 Tg and WT mice that were fed with or without Dox (200 mg/kg regular chow diet) for 1 week. The primer pair for Q-PCR recognized both the transgenic and endogenous Mmp14 by probing the exons of Mmp14 (n = 6 per group, Student t test; ***, P < 0.001). (F) Body weights of MMP14 Tg and WT mice upon Dox (200 mg/kg regular chow diet) feeding for 1 week (n = 6 per group, Student t test). (G) Schematic diagram showing the long-term HFD feeding program. The MMP14 Tg and WT mice were fed on HFD for 13 weeks and then fed on HFD plus DOX (200 mg/kg diet) for 5 more weeks. (H) Body weights of MMP14 Tg and WT mice after a long-term HFD feeding as shown in panel G (n = 5 or 6 per group, Student t test; **, P < 0.01). (I) Gains in body weight of MMP14 Tg and WT mice after a long-term HFD feeding (n = 5 or 6 per group, Student t test; **, P < 0.01). (J) MRI analysis for fat mass of MMP14 Tg and WT mice after a long-term HFD feeding (n = 5 or 6 per group, Student t test; **, P < 0.01). (K) MRI analysis for lean masses of MMP14 Tg and WT mice after a long-term HFD feeding (n = 5 or 6 per group, Student t test). (L) Images of eWAT, sWAT, and BAT collected from MMP14 Tg and WT mice after a long-term HFD feeding. (M) H&E staining of eWAT, sWAT, BAT, and liver collected from MMP14 Tg and WT mice after long-term HFD feeding. The arrows indicate lipid droplets accumulated in the liver. (N) Frequency distribution of different-sized adipocytes of eWAT of MMP14 Tg and WT mice after long-term HFD feeding (adipocytes from five to six mice per group were analyzed). (O) Comparison of average adipocyte sizes of eWAT between MMP14 Tg and WT mice after long-term HFD feeding (adipocytes from five to six mice per group were analyzed, Student t test; ***, P < 0.001). (P) Frequency distribution of different-sized adipocytes of sWAT in MMP14 Tg and WT mice after long-term HFD feeding (adipocytes from five to six mice per group were analyzed). (Q) Comparison of average adipocyte sizes of sWAT between MMP14 Tg and WT mice after long-term HFD feeding (adipocytes from five to six mice per group were analyzed, Student t test).


