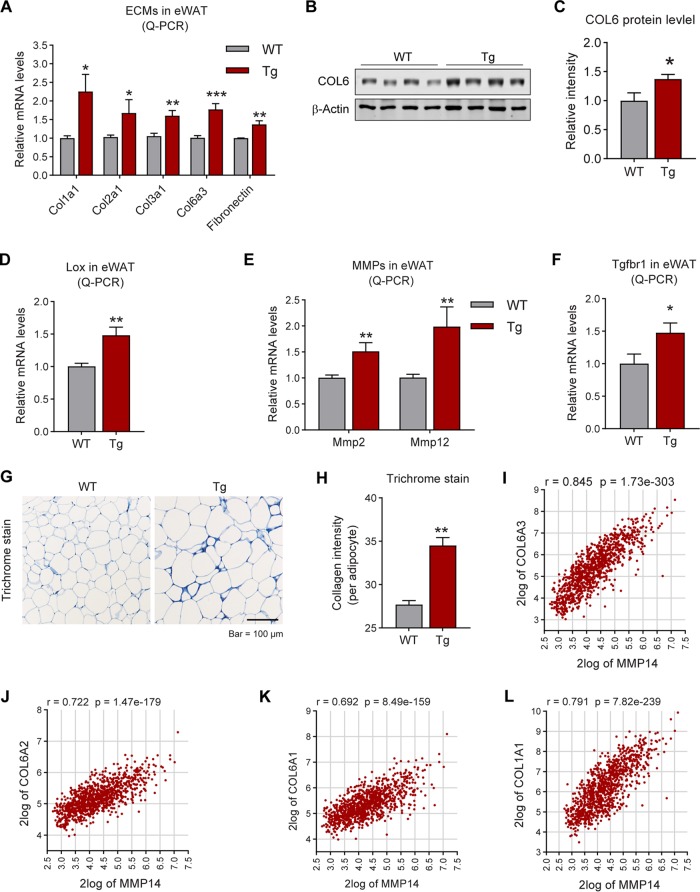
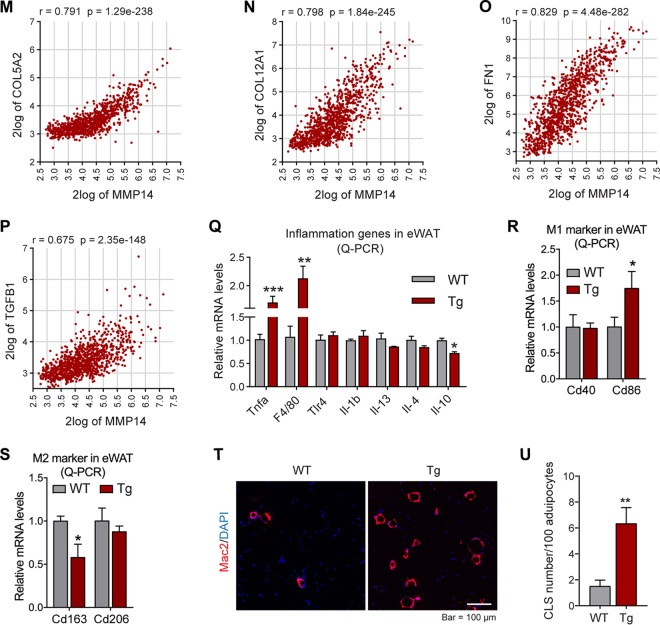
FIG 6.
Overexpression of MMP14 in established obese adipose tissue stimulates local fibrosis and inflammation. (A) Q-PCR analysis of ECM-component genes, including Col1a1, Col2a1, Col3a1, Col6a3, and Fibronectin, in the eWAT of MMP14 Tg and WT mice after long-term HFD feeding (n = 5 per group, Student t test; *, P < 0.05; **, P < 0.01; ***, P < 0.001). (B) Western blotting of COL6 in the eWAT of MMP14 Tg and WT mice after long-term HFD feeding (n = 5 per group, representative of three trials). (C) Quantification of the band density of the Western blotting in panel B (n = 5 per group, Student t test; *, P < 0.05). (D) Q-PCR analysis of Lox (lysyl oxidase, a collagen linking enzyme) in the eWAT of MMP14 Tg and WT mice after long-term HFD feeding (n = 5 per group, Student t test; **, P < 0.01). (E) Q-PCR analysis of Mmp2 and Mmp12 in the eWAT of MMP14 Tg and WT mice after long-term HFD feeding (n = 5 per group, Student t test; **, P < 0.01). (F) Q-PCR analysis of Tgfβr1 in the eWAT of MMP14 Tg and WT mice after long-term HFD feeding (n = 5 per group, Student t test; *, P < 0.05). (G) Trichrome staining of eWAT in the MMP14 Tg and WT mice after a long-term HFD feeding (n = 5 per group, representative of three trials). (H) Quantification of the density of dark blue in panel G (n = 5 per group, representative of three trials, Student t test; **, P < 0.01). (I to P) Correlation analysis between MMP14 and ECM genes, including COL6A3 (I), COL6A2 (J), COL6A1 (K), COL1A1 (L), COL5A2 (M), COL12A1 (N), FN1 (O), and TGFB1 (P), in the public breast tumor data set (n = 1,110) using genomics analysis and the visualization platform R2 (https://hgserver1.amc.nl/cgi-bin/r2/main.cgi). The correlation coefficient r value and the significance P value were autocalculated by the platform. (Q) Q-PCR analysis of proinflammatory and anti-inflammatory genes, including Tnfα, F4/80, Tlr4, Il1β, Il13, Il4, and Il10, in the eWAT of MMP14 Tg and WT mice after long-term HFD feeding (n = 5 per group, Student t test; *, P < 0.05; **, P < 0.01; ***, P < 0.001). (R) Q-PCR analysis of M1-phase macrophage markers, including Cd40 and Cd86, in the eWAT of MMP14 Tg and WT mice after long-term HFD feeding (n = 5 per group, Student t test; *, P < 0.05). (S) Q-PCR analysis of M2-phase macrophage markers, including Cd163 and Cd206, in the eWAT of MMP14 Tg and WT mice after long-term HFD feeding (n = 5 per group, Student t test; *, P < 0.05). (T) IF staining with anti-Mac2 antibody (marker of macrophage) in the eWAT of MMP14 Tg and WT mice after long-term HFD feeding. Nuclei were stained by DAPI (4′,6′-diamidino-2-phenylindole; n = 5 per group, representative of three trials). (U) Quantification of crown-like structures (CLS) formed by macrophage accumulation in panel T (n = 5 per group, Student t test; **, P < 0.01).


