FIG 8.
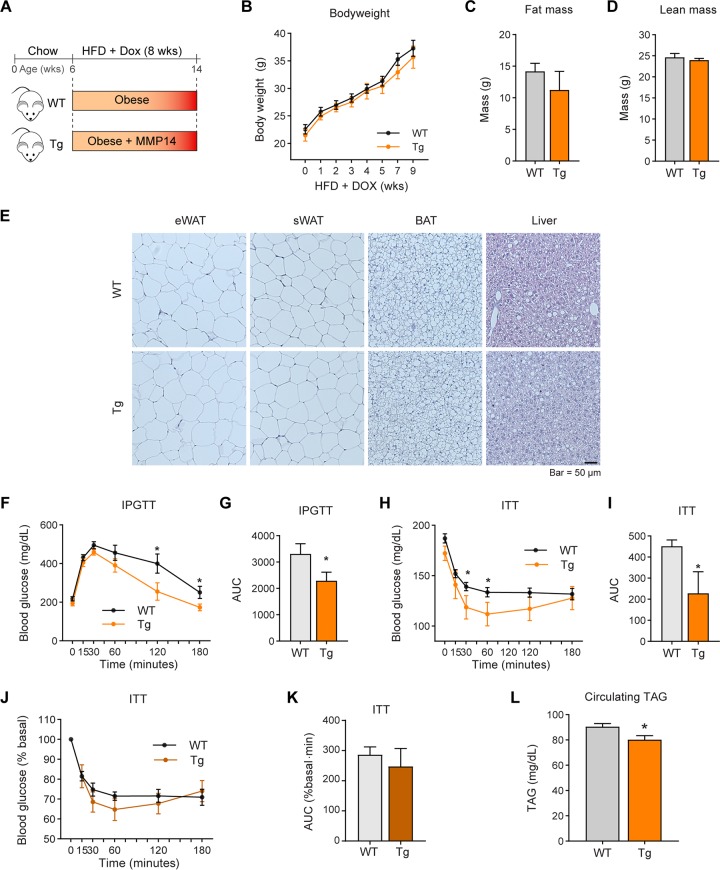
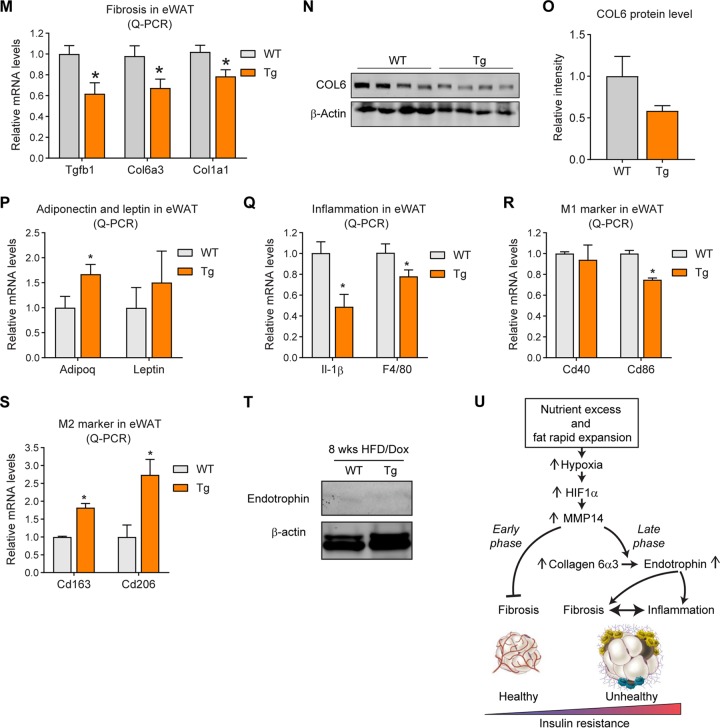
Overexpression of MMP14 in early-stage obese adipose tissue brings about metabolically healthy profile. (A) Schematic diagram showing the short-term HFD feeding program. The MMP14 Tg and WT mice were fed on HFD plus Dox (200 mg/kg diet) for 8 weeks. (B) Body weights of MMP14 Tg and WT mice during short-term HFD feeding (n = 6 per group, Student t test, no significant difference between the groups). (C) MRI analysis for fat mass of MMP14 Tg and WT mice after short-term HFD feeding (n = 6 per group, Student t test, no significant difference between the groups). (D) MRI analysis for lean masses of MMP14 Tg and WT mice after short-term HFD feeding (n = 6 per group, Student t test, no significant difference between the groups). (E) H&E staining of eWAT, sWAT, BAT, and liver in the MMP14 Tg and WT mice after short-term HFD feeding (n = 6 per group, representative of three trials). (F) IPGTT of MMP14 Tg and WT mice after short-term HFD feeding (n = 6 per group, Student t test; *, P < 0.05). (G) Area under the curve (AUC) for the IPGTT performed in panel F (n = 6 per group, Student t test; *, P < 0.05). (H) ITT of MMP14 Tg and WT mice after short-term HFD feeding (n = 6 per group, Student t test; *, P < 0.05). (I) AUC for the ITT performed in panel H (n = 6 per group, Student t test; *, P < 0.05). (J) The ITT result in panel H is shown as a percentage of the basal level (n = 6 per group, Student t test). (K) AUC for the graph presented in panel J (n = 6 per group, Student t test). (L) Fasting circulating triacylglycerol (TAG) levels in MMP14 Tg and WT mice after short-term HFD feeding (n = 6 per group, Student t test; *, P < 0.05). (M) Q-PCR analysis of ECM-component genes, including Tgfβ1, Col6α3, and Col1α1, in the eWAT of MMP14 Tg and WT mice after short-term HFD feeding (n = 6 per group, Student t test; *, P < 0.05). (N) Western blotting of COL6 in the eWAT of MMP14 Tg and WT mice after short-term HFD feeding (n = 6 per group, representative of three trials). (O) Quantification of the band density of the Western blotting in panel N (n = 6 per group, Student t test). (P) Q-PCR analysis of Adiponectin and Leptin in the eWAT of MMP14 Tg and WT mice after short-term HFD feeding (n = 6 per group, Student t test; *, P < 0.05). (Q) Q-PCR analysis of proinflammatory genes, including Il1β and F4/80, in the eWAT of MMP14 Tg and WT mice after short-term HFD feeding (n = 6 per group, Student t test; *, P < 0.05). (R) Q-PCR analysis of M1-phase macrophage markers, including Cd40 and Cd86, in the eWAT of MMP14 Tg and WT mice after short-term HFD feeding (n = 6 per group, Student t test; *, P < 0.05). (S) Q-PCR analysis of M2-phase macrophage markers, including Cd163 and Cd206, in the eWAT of MMP14 Tg and WT mice after short-term HFD feeding (n = 6 per group, Student t test; *, P < 0.05). (T) Western blotting of endotrophin in the eWAT of MMP14 Tg and WT mice after short-term HFD feeding. The endotrophin molecules were enriched from samples by immunoprecipitation with antiendotrophin antibody (n = 6 per group, representative of three trials). (U) Proposed working model of the study. During diet-induced obesity, local hypoxia induces HIF1α in adipose tissue. As a direct target of HIF1α, MMP14 is upregulated. At the early stage of obesity development, MMP14 digests collagens and prevents fibrosis, which then promotes healthy expansion of the tissue. At the late stage of obesity, tremendous amounts of COL6 accumulate in adipose tissue. MMP14 digests COL6α3 chain and produces endotrophin. Accumulation of endotrophin further shapes unhealthy microenvironment locally in the adipose tissue by triggering massive fibrosis and inflammation. The local pathological changes ultimately lead to systemic insulin resistance and other metabolic disorders.


