FIG 4.

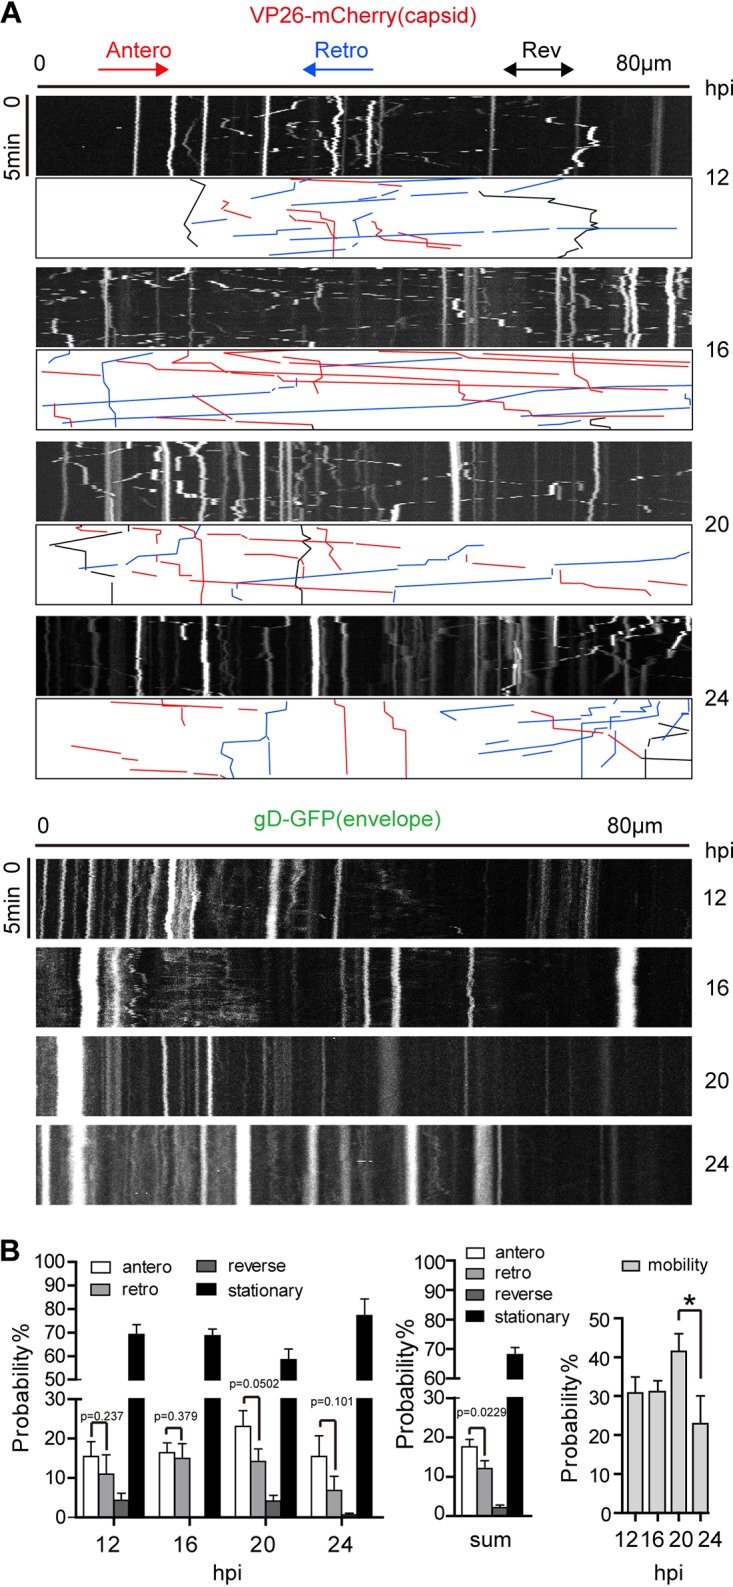
Capsid particles are more motile than enveloped particles in cortical neuron axons. Neurons were cultured for 10 to 14 days and then infected by adding H129-G/R into the soma side at an MOI of 1. The movements of capsids (represented by VP26-mCherry particle) and the envelope particles (represented by gD-GFP particle) were captured by live-cell imaging, and moving characteristics were analyzed. (A) Kymographs for movement of VP26-mCherry puncta (capsids) and gD-GFP puncta (envelopes) in axons. Axon bundle length, 80 μm (horizontal line). Duration of imaging, 5 min (vertical line). Shown are representative kymographs of imaging data obtained at different time points postinfection (12, 16, 20, and 24 hpi). Color-coded traces of anterograde (red), retrograde (blue), and reverse (black) movements were used to quantify puncta transport. (B) Quantification of movement dynamics of VP26-mCherry puncta. The different characteristics of capsid movement were observed, including anterograde movement (antero), retrograde movement (retro), reverse, and stationary state. (Left) Proportions of capsids in the four states at 12, 16, 20, and 24 hpi. (Center) The sum of capsids in the four states at 12, 16, 20, and 24 hpi. (Right) Capsid motility (including movement in anterograde, retrograde, and reverse state) at 12, 16, 20, and 24 hpi. Data were acquired from 3 view fields of each experiment; 3 independent experiments were performed; and 116, 209, 222, and 201 puncta were counted for 12, 16, 20, and 24 hpi, respectively. P value indicates the significant difference between anterograde and retrograde movement, analyzed by Student’s t test. *, P < 0.05; mobility data at 12, 16, 20, and 24 hpi were analyzed by one-way ANOVA followed by Tukey’s test. The results are shown as mean ± SEM.
