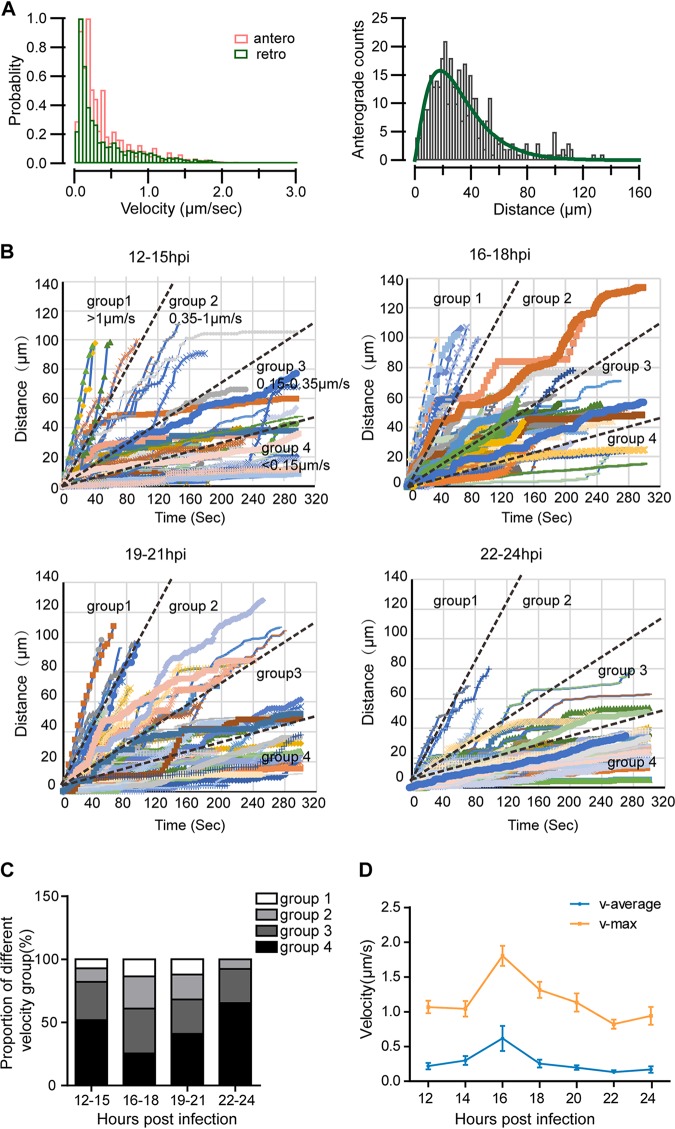
FIG 5.
Capsid motility fluctuates with the time of infection. Neurons were cultured for 10 to 14 days and then infected by adding H129-G/R into the soma side at an MOI of 1. The movements of capsids were captured by live-cell imaging, and moving characteristics were analyzed. (A) (Left) Instantaneous velocity distributions of anterogradely (orange histogram) and retrogradely (green histogram) moving capsids. (Right) The histogram of run lengths of anterograde movements and fit using gamma distribution; alpha is 2.2779 ± 0.18, and beta is 14.037 ± 1.52. (B) The time-distance traces of every anterogradely moving capsid during different time periods (12 to 15 hpi, 16 to 18 hpi, 19 to 21 hpi, and 22–24 hpi) were collected. The traces were classified into the following four velocity groups: group 1, fast (>1 μm/s); group 2, medium fast (0.35 to 1 μm/s); group 3, medium (0.15 to 0.35 μm/s); and group 4, slow (<0.15 μm/s). (C) The proportion of the four velocity groups during the indicated periods. (D) Average velocity and maximum velocity of anterograde moving capsids during different periods of 12 to 24 hpi. Data were acquired from 233 anterograde moving capsids from 120 fields of 3 independent experiments.

