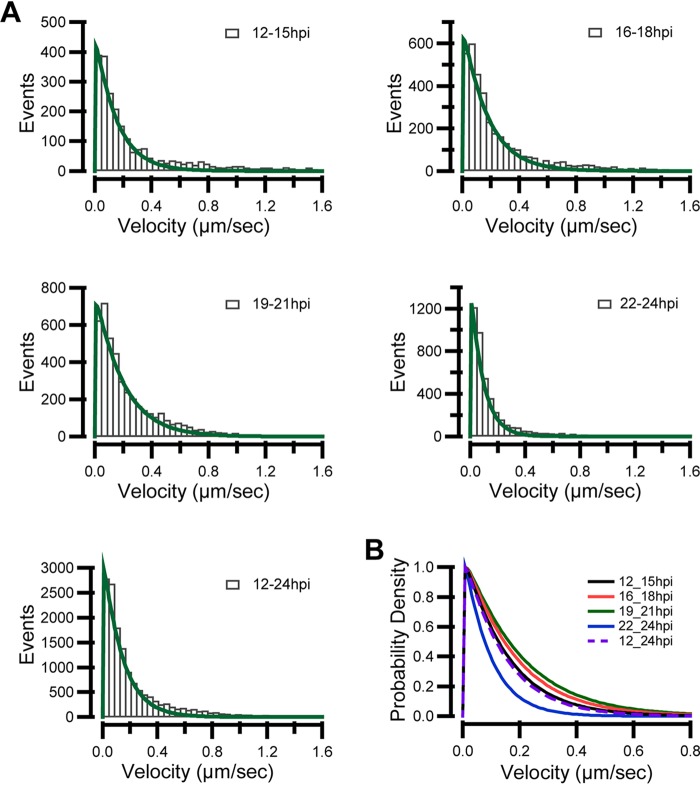
FIG 6.
Instantaneous velocity distributions of anterograde transporting capsids. Neurons were cultured for 10 to 14 days and then infected by adding H129-G/R into the soma side at an MOI of 1. The movements of capsids were captured by live-cell imaging, and moving characteristics were analyzed. (A) Instantaneous velocity distributions of anterogradely moving capsids in different time periods, namely, 12 to 15 hpi, 16 to 18 hpi, 19 to 21 hpi, and 22 to 24 hpi and the total during 12 to 24 hpi. Data were described using a gamma distribution, shape parameter α ranged from 1.0466 to 1.0699, and a fixed α of 1.05 was used. The values of the scale parameter β were 0.14162 ± 0.0055 during 12 to 15 hpi, 0.16444 ± 0.00553 during 16 to 18 hpi, 0.18309 ± 0.00593 during 19 to 21 hpi, and 0.086236 ± 0.00192 during 22 to 24 hpi, while it was 0.13191 ± 0.00401 during 12 to 24 hpi. The larger the scale parameter of β, the more spread out the distribution is. (B) Modeled probability of velocity distribution was plotted to summarize velocity distributions for each period using normalized gamma distribution. Data were acquired from 347 anterogradely moving capsids from 120 fields of 3 independent experiments.

