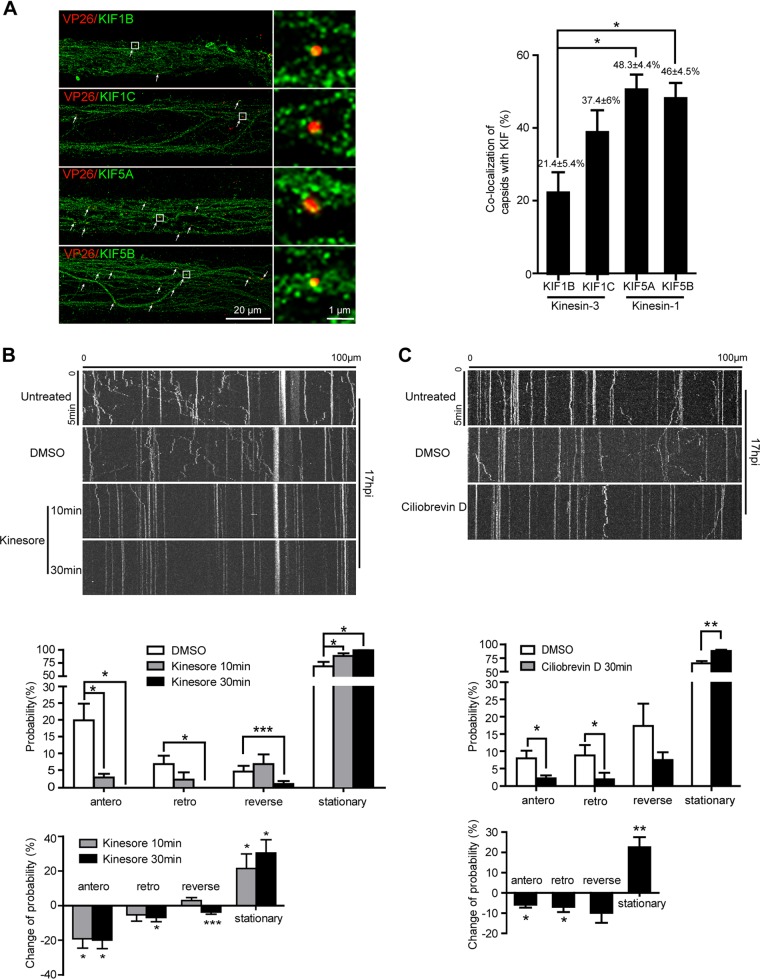
FIG 7.
Kinesin-1 is required for anterograde transport of HSV-1 capsids in axons. (A) Primary mouse embryonic cortical neurons were cultured in the microfluidic chamber for 14 days and then infected with H129-VP26-mCherry at the soma side at an MOI of 1. At 24 hpi, neurons were fixed and stained with indicated kinesin antibodies, followed by superresolution imaging analysis. Shown are representative superresolution images of axon bundle; colocalization of capsids with kinesins is defined as Pearson’s correlation coefficients (PCCs) above 0.5, which is indicated by arrows. Scale bar: 20 μm. Data were collected from at least 18 fields/group of 3 independent experiments and analyzed by one-way ANOVA followed by Tukey’s test. Results are shown as mean ± SEM. *, P < 0.05. (B) Primary mouse embryonic cortical neurons cultured in the microfluidic chamber for 14 days were infected with H129-VP26-mCherry at an MOI of 1. At 17 hpi, neurons were treated with dimethyl sulfoxide (DMSO) for 30 min or kinesore (100 μM) for 10 min or 30 min. Movement of capsids (VP26-mCherry puncta) in axons was observed by live-cell imaging. (Top) Kymographs for movement of capsids without treatment, with DMSO treatment, or with kinesore treatment for 10 min or 30 min in the same field. (Middle) Quantification of the motility of capsids with the treatment of DMSO or kinesore. (Bottom) Quantification of motility changes normalized to the DMSO vehicle control. Data were acquired from 4 view fields containing 20 to 41 VP26 puncta for each group. *, P < 0.05; ***, P < 0.001. (C) Movement of capsids upon ciliobrevin D treatment. (Top) Kymographs for movement of capsids exposed to DMSO or ciliobrevin D (200 μM) at 17 hpi for 30 min; movements of capsids in the same field were captured as described in B. (Middle) Quantification of capsid motility. (Bottom) Quantification of motility changes normalized to the DMSO vehicle control. Data were acquired from 4 view fields containing 23 to 53 capsids. Statistically significant change in probability compared with control was analyzed by Student’s t test. Results are shown as mean ± SEM. *, P < 0.05; **, P < 0.01; ***, P < 0.001.

