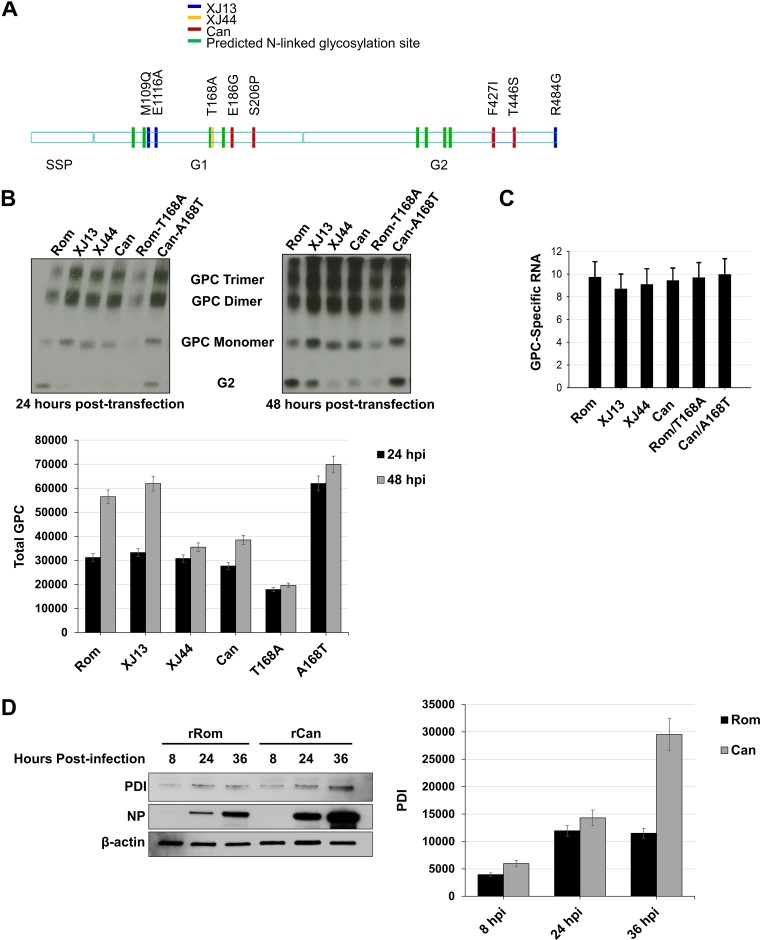
FIG 1.
Comparison of total detectable GPC in HEK293 cells and chaperone upregulation in infected Vero cells. (A) Schematic representation of amino acid substitutions between Rom GPC and the GPCs from key passages in the creation of the Can vaccine. Differences in XJ13 and Rom are indicated in blue, differences between XJ13 and XJ44 are indicated in yellow, and Can-specific amino acids are indicated in red. The green marks represent N-linked glycosylation motifs. (B) HEK293 cells were seeded into 12-well plates (1 × 10⁵ cells/well) and allowed to incubate for 24 h at 37°C prior to transfection. The cells were transfected with plasmids expressing either Rom, XJ13, XJ44, Can, Rom-T168A, or Can-A168T GPC and allowed to incubate for an additional 24 to 48 h. Cells were lysed using Triton X-100 lysis buffer at 24 or 48 h posttransfection, and proteins were detected under nonreducing conditions with an anti-JUNV G2 antibody. Cellular proteins were detected using commercially available antibodies. Total GPC stained in each lane was quantified using ImageJ for each time point, and the results are shown as a bar graph. Whiskers represent the standard error among triplicate results for each value. (C) Duplicates of samples from panel B were treated with TRIzol at 24 h posttransfection, and RNA was isolated from cell lysates. The RNA was quantified using real-time PCR, and the GPC total RNA was normalized to GAPDH RNA. The experiment was repeated in triplicate. Whiskers are the standard error values among sample replicates, and ANOVA was performed to measure significance between groups (see Results). (D) Vero cells were prepared and infected with either rRom or rCan virus (MOI, 1.0). Lysates were collected at the indicated time points (8 hpi, 24 hpi, and 36 hpi) and stained for intracellular PDI and viral NP. PDI bands in each lane were quantified using ImageJ for each time point, and the results are shown as a bar graph. Whiskers represent the standard error among triplicate results for each value. ANOVA was performed to measure significance between groups (see Results).

