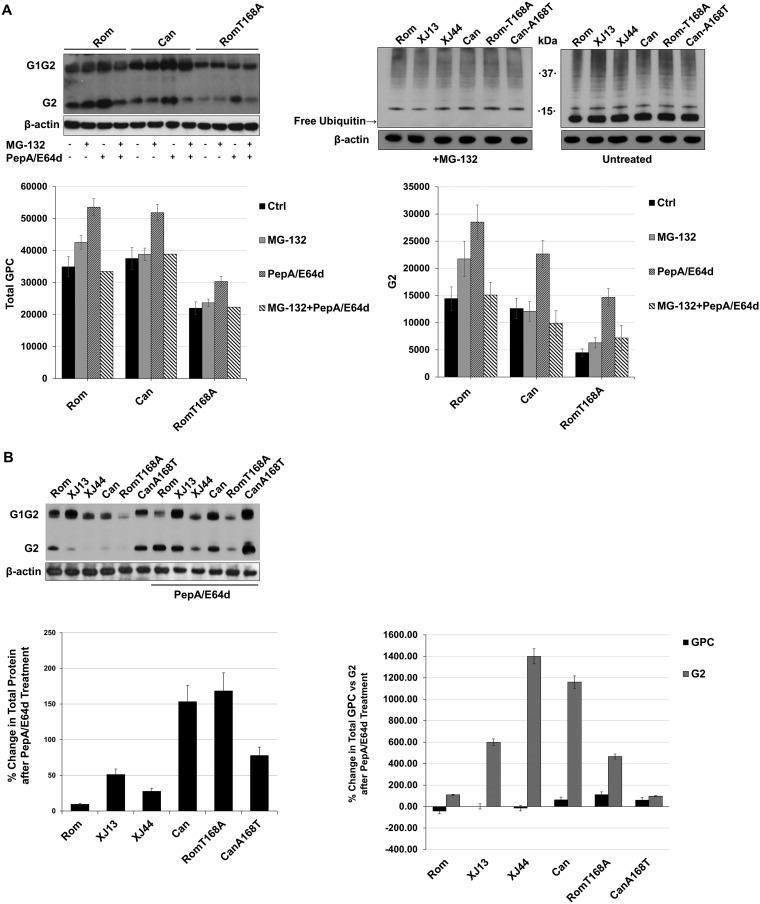
FIG 2.
Comparison of cellular degradation pathway activity during JUNV GPC expression. (A) BHK-21 cells were seeded into 12-well plates (1 × 10⁵ cells/well) and incubated at 37°C for 24 h prior to transfecting the cells with plasmids expressing either Rom, Can, or Rom-T168A. After an additional 28 h, the indicated cells were treated with either MG-132 (1 μM) or PepA/E64d (10 μg/ml each) and allowed to incubate for another 8 h. The cells were lysed with Laemmli’s SDS buffer, and GPC was detected with an anti-JUNV G2 antibody. Cellular proteins were detected with commercially available antibodies. Densitometries for both total GPC and G2 were obtained using ImageJ, and the results are shown in graphs to compare either total GPC or G2 among treatments. Whiskers represent the standard error among triplicate results for each value. (B) HEK293 cells were prepared identically to the cells in panel A and transfected with plasmids expressing either Rom, XJ13, XJ44, Can, Rom-T168A, or Can-A168T GPC. Treatments and transfections were repeated using conditions identical to those in panel A, and the protein was detected using anti-JUNV G2 antibodies. Ubiquitin was stained in MG-132-treated cells to confirm that the inhibitor was depleting free ubiquitin to validate the results in panel A. Densitometries were obtained for G2 using ImageJ on a scale of 0 to 100, where 100 represents complete saturation. Fold change in G2 was calculated for untreated samples compared to samples treated with PepA/E64D. Densitometry values are provided for total GPC, full-length GPC, and G2. Whiskers represent the standard error among triplicate results for each value. ANOVA was performed to determine statistical significance between groups (see Results).

