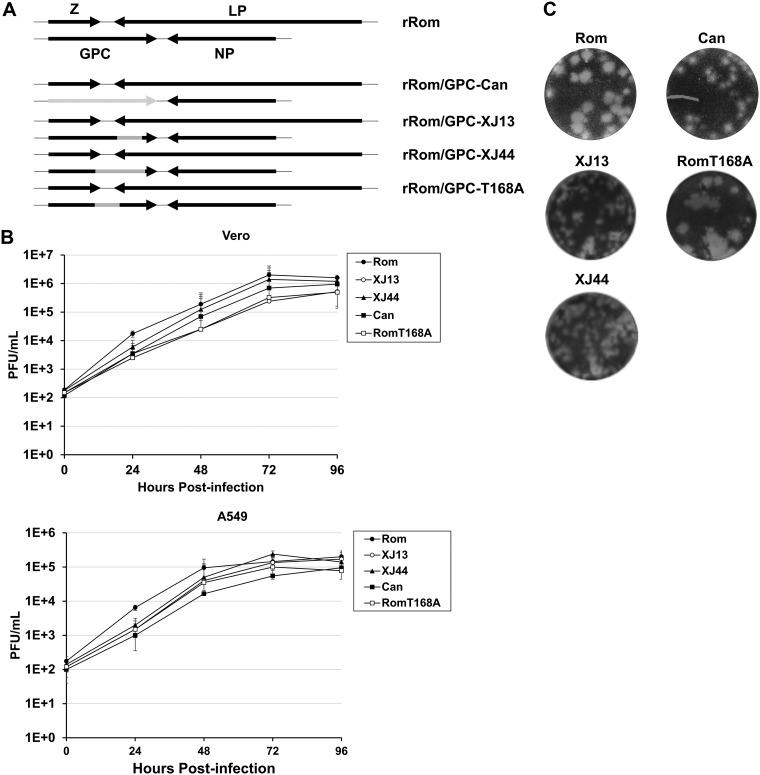
FIG 3.
Growth kinetics of recombinant JUNVs expressing all or part of Can GPC. (A) Schematic representation of viruses rescued. Gray represents Can-like regions. Specific mutations for these regions can be cross-referenced using Fig. 1A. (B) Vero and A549 cell monolayers were infected with working stocks of the viruses (MOI, 0.1) illustrated in panel A. Supernatant was collected every 24 h and subjected to plaque assay to quantify infectious progeny. Plaque assays were performed using Vero cell monolayers cultured in 6-well plates. Serial dilutions of supernatant were used to infect the monolayers and incubated with a 1% agarose overlay for 5 days. Cells were fixed in formalin and stained with crystal violet. The samples were generated in triplicate, and the whiskers represent the standard error among replicates at each point. (C) Plaque phenotypes for each virus. Images were taken from plaque assay titration of the purified working stock in the same manner as described in panel B.

