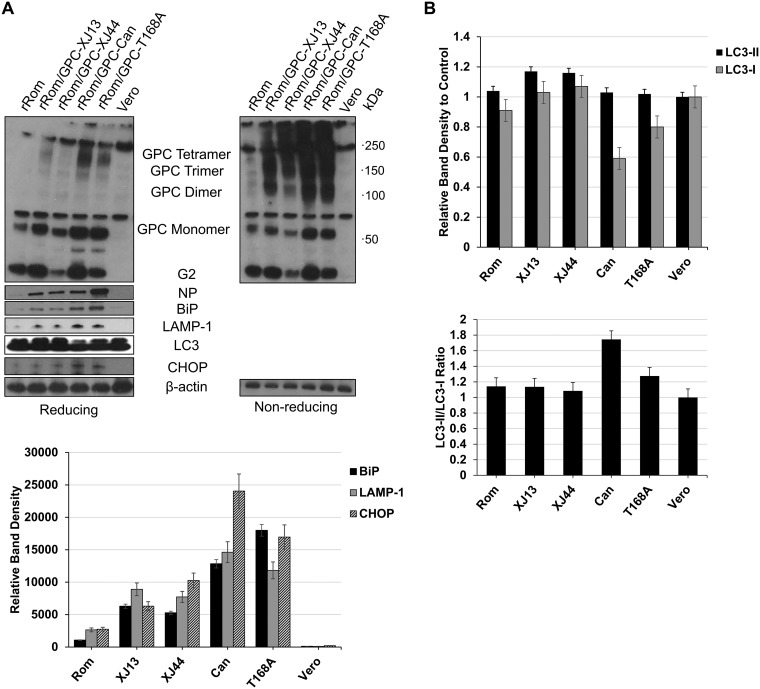
FIG 4.
Aggregation of GPC and upregulation of ER stress-related markers during infection. (A) Expression of total viral protein and stress markers in Vero cells. Vero cells were seeded into 12-well plates (1 × 10⁵ cells/well) and incubated at 37°C for 24 h. The cells were infected (MOI, 5) with each of the viruses from Fig. 4 and allowed to incubate for 48 h before lysing the cells in Laemmli’s SDS buffer. Viral protein was detected using custom anti-JUNV G2 and NP antibodies. The cellular proteins BiP, LAMP-1, LC3, and CHOP were stained using commercially available antibodies. Bands for BiP, LAMP-1, and CHOP were quantified using ImageJ. Whiskers represent the standard error among triplicate results for each value. (B) Western blot images of LC3 were analyzed in ImageJ to quantify LC3-I and LC3-II. Ratios of LC3-II to LC3-I were compared relative to uninfected Vero cells to detect potential increases in autophagy. Whiskers represent the standard error among triplicate results for each value. ANOVA was performed to determine statistical significance between groups (see Results).

