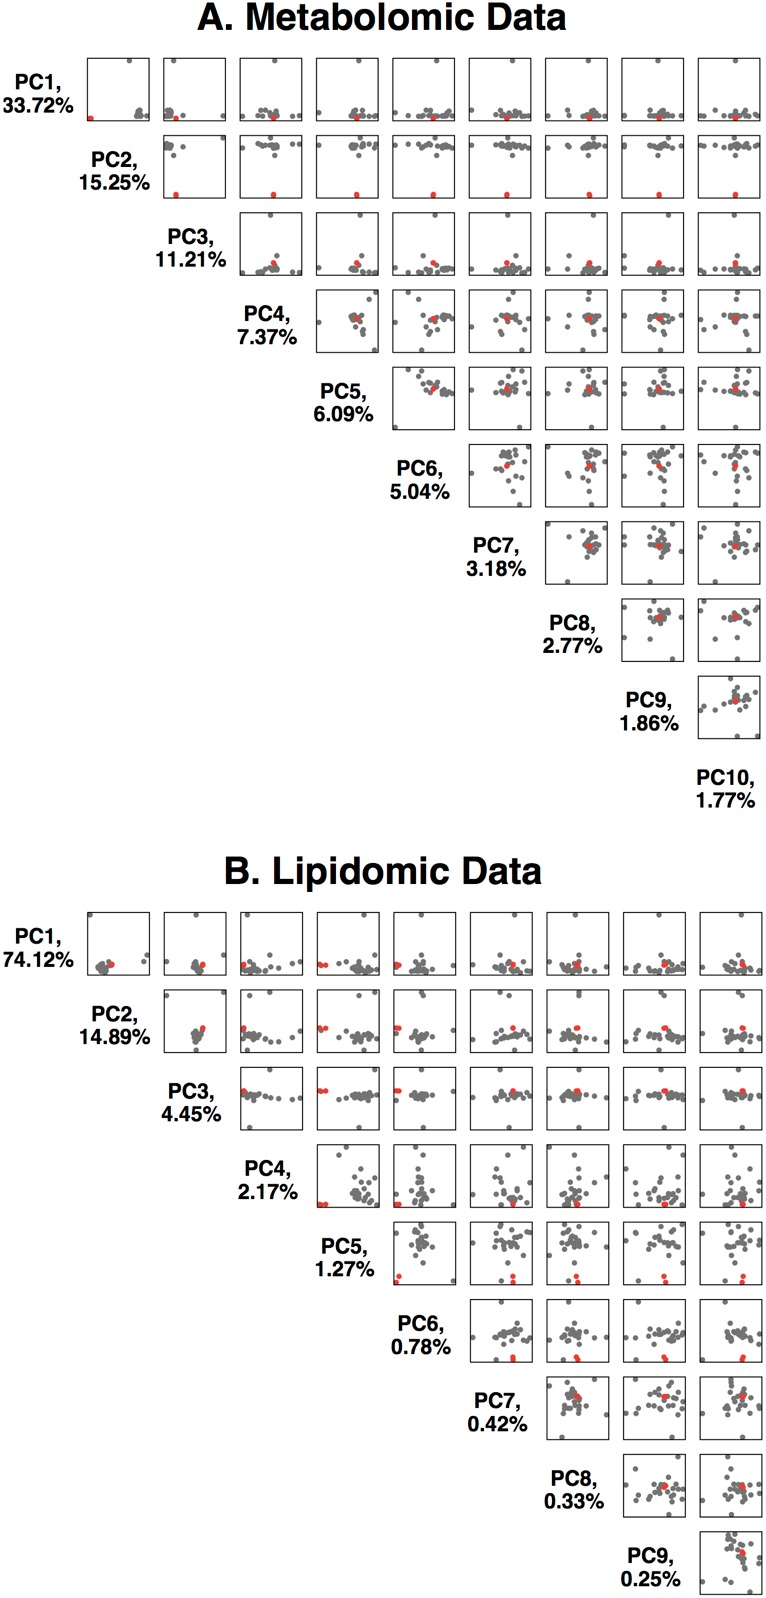
Figure 2. Principal component analysis of the Metabolon metabolomics data.

(A) Data is available in Supplementary file 1. The first 10 principal components are plotted against each other, with %variance explained. The two replicates of the HAO1 knockout volunteer are shown as red dots, control individuals as black dots. (B) Principal component analysis of the Metabolon lipidomics data. Data is available in Supplementary file 2.
