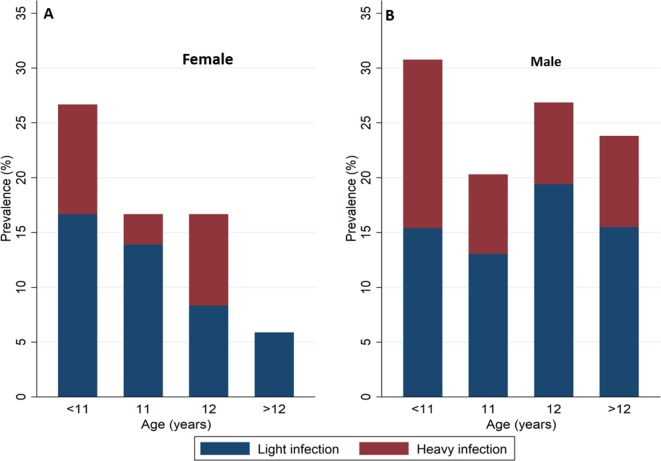
Figure 3. Prevalence of Schistosoma haematobium re-infection and intensity of re-infection by age and sex among children taking part in the re-infection cohort (n = 378).
Blue represents light re-infections (<50 eggs per 10 ml urine) and Red represents heavy re-infections (≥50 eggs per 10 ml urine). Panels A and B show the prevalence of Schistosoma haematobium for female and male children respectively.

