
Figure 4. Margin plot of piped water coverage and re-infection intensity.
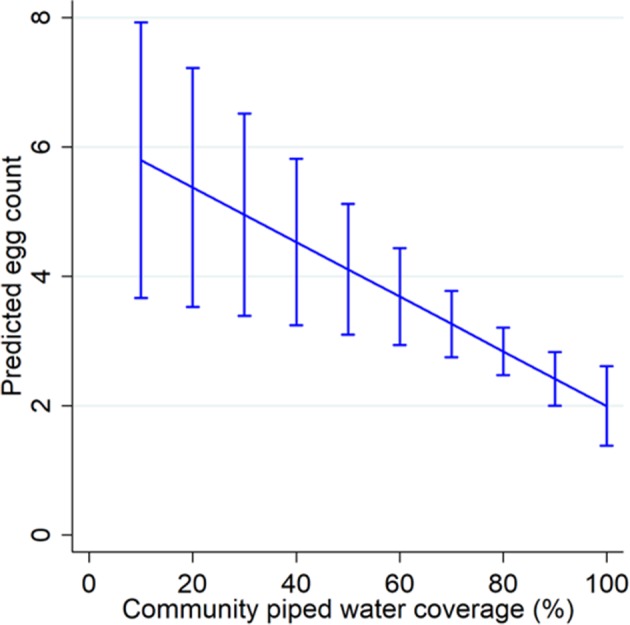
The margin plot was constructed from the final parsimonious multivariable negative binomial regression model for the pooled dataset (n = 378, incidence rate ratio = 0.96, p=0.004). Piped water coverage was estimated using the Gaussian kernel density methodology.